|
Download Data (XLS File) |
|
||||||||
|
||||||||
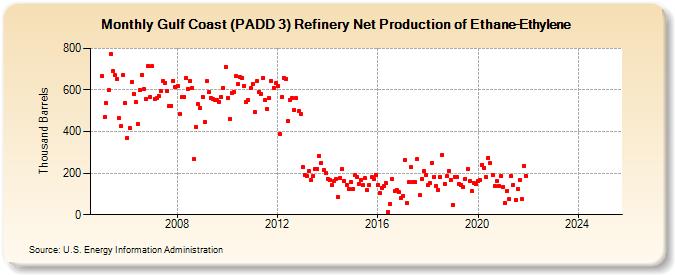
| Gulf Coast (PADD 3) Refinery Net Production of Ethane-Ethylene (Thousand Barrels) | ||||||||
| Year | Jan | Feb | Mar | Apr | May | Jun | Jul | Aug | Sep | Oct | Nov | Dec |
|---|---|---|---|---|---|---|---|---|---|---|---|---|
| 2005 | 667 | 468 | 537 | 598 | 774 | 689 | 671 | 652 | 464 | 426 | 673 | 539 |
| 2006 | 370 | 417 | 640 | 582 | 541 | 436 | 598 | 674 | 603 | 556 | 715 | 567 |
| 2007 | 713 | 557 | 559 | 572 | 594 | 641 | 635 | 597 | 522 | 525 | 645 | 612 |
| 2008 | 619 | 483 | 566 | 566 | 658 | 605 | 643 | 610 | 269 | 423 | 531 | 512 |
| 2009 | 567 | 447 | 641 | 590 | 562 | 557 | 553 | 551 | 544 | 567 | 610 | 712 |
| 2010 | 562 | 462 | 586 | 591 | 665 | 627 | 661 | 659 | 621 | 540 | 550 | 609 |
| 2011 | 629 | 495 | 643 | 590 | 582 | 659 | 550 | 510 | 559 | 644 | 611 | 632 |
| 2012 | 621 | 387 | 567 | 659 | 655 | 451 | 553 | 563 | 504 | 561 | 497 | 486 |
| 2013 | 229 | 192 | 184 | 208 | 165 | 186 | 222 | 222 | 283 | 249 | 216 | 201 |
| 2014 | 172 | 167 | 144 | 161 | 172 | 84 | 177 | 220 | 162 | 143 | 124 | 158 |
| 2015 | 123 | 191 | 182 | 148 | 167 | 141 | 175 | 119 | 142 | 179 | 172 | 193 |
| 2016 | 143 | 104 | 130 | 140 | 151 | 11 | 53 | 170 | 114 | 121 | 107 | 81 |
| 2017 | 91 | 265 | 55 | 157 | 229 | 159 | 155 | 266 | 93 | 172 | 210 | 193 |
| 2018 | 141 | 153 | 249 | 182 | 138 | 121 | 183 | 289 | 149 | 184 | 211 | 167 |
| 2019 | 49 | 183 | 182 | 150 | 144 | 131 | 173 | 221 | 160 | 113 | 154 | 146 |
| 2020 | 163 | 168 | 241 | 227 | 180 | 274 | 247 | 191 | 137 | 161 | 139 | 186 |
| 2021 | 133 | 57 | 116 | 75 | 186 | 143 | 73 | 125 | 169 | 75 | 236 | 186 |
| 2022 | -- | -- | -- | -- | -- | -- | -- | -- | -- | -- | -- | -- |
| 2023 | -- | -- | -- | -- | -- | -- | -- | -- | -- | -- | -- | -- |
| 2024 | -- | |||||||||||
| - = No Data Reported; -- = Not Applicable; NA = Not Available; W = Withheld to avoid disclosure of individual company data. |
| Release Date: 3/29/2024 |
| Next Release Date: 4/30/2024 |
Referring Pages: