|
Download Data (XLS File) |
|
||||||||
|
||||||||
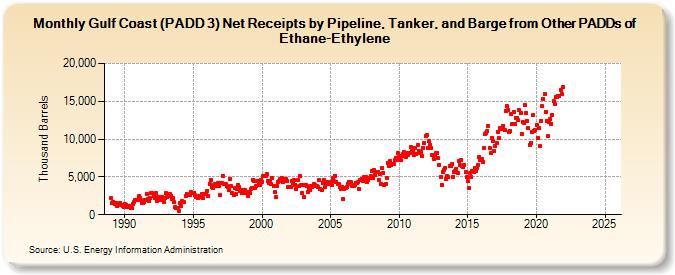
| Gulf Coast (PADD 3) Net Receipts by Pipeline, Tanker, and Barge from Other PADDs of Ethane-Ethylene (Thousand Barrels) | ||||||||
| Year | Jan | Feb | Mar | Apr | May | Jun | Jul | Aug | Sep | Oct | Nov | Dec |
|---|---|---|---|---|---|---|---|---|---|---|---|---|
| 1989 | 2,187 | 1,521 | 1,689 | 1,467 | 1,566 | 1,153 | 1,349 | 1,394 | 1,567 | 1,271 | 1,155 | 1,009 |
| 1990 | 1,386 | 1,303 | 1,081 | 1,031 | 1,159 | 943 | 847 | 1,368 | 1,616 | 1,895 | 1,937 | 1,957 |
| 1991 | 2,432 | 2,175 | 1,969 | 1,562 | 1,604 | 1,658 | 1,892 | 2,764 | 2,025 | 1,756 | 2,195 | 2,819 |
| 1992 | 2,832 | 2,430 | 2,235 | 2,827 | 1,773 | 2,329 | 1,924 | 1,895 | 2,389 | 2,030 | 1,719 | 2,164 |
| 1993 | 2,858 | 2,322 | 2,454 | 2,742 | 2,447 | 2,063 | 2,172 | 1,636 | 966 | 914 | 927 | 449 |
| 1994 | 1,501 | 1,125 | 1,769 | 1,725 | 1,618 | 2,500 | 2,805 | 2,584 | 2,545 | 2,628 | 2,960 | 2,843 |
| 1995 | 2,931 | 2,554 | 2,281 | 2,291 | 2,235 | 2,410 | 2,284 | 2,772 | 2,261 | 2,697 | 2,687 | 2,700 |
| 1996 | 3,136 | 2,448 | 4,104 | 4,654 | 3,647 | 3,514 | 3,878 | 4,096 | 3,788 | 4,173 | 3,758 | 2,594 |
| 1997 | 4,147 | 4,144 | 5,182 | 4,077 | 4,022 | 3,743 | 3,612 | 3,276 | 4,709 | 3,740 | 2,903 | 2,658 |
| 1998 | 3,485 | 2,766 | 3,413 | 3,991 | 3,644 | 3,175 | 2,834 | 3,242 | 2,985 | 3,298 | 2,924 | 3,042 |
| 1999 | 2,458 | 2,891 | 3,420 | 3,555 | 4,629 | 4,512 | 3,480 | 3,751 | 4,469 | 4,155 | 3,896 | 4,650 |
| 2000 | 4,362 | 5,085 | 5,154 | 5,183 | 5,365 | 4,445 | 4,172 | 4,400 | 4,008 | 4,836 | 3,775 | 2,993 |
| 2001 | 2,333 | 3,813 | 4,381 | 4,445 | 4,769 | 4,880 | 4,320 | 4,715 | 4,727 | 4,722 | 4,458 | 3,635 |
| 2002 | 3,719 | 3,648 | 4,397 | 4,132 | 4,545 | 3,950 | 3,368 | 4,587 | 3,761 | 5,066 | 3,913 | 2,870 |
| 2003 | 3,934 | 2,345 | 3,886 | 3,818 | 2,973 | 3,381 | 3,205 | 3,798 | 3,671 | 4,039 | 3,954 | 3,784 |
| 2004 | 3,792 | 3,631 | 4,605 | 3,371 | 3,234 | 4,222 | 4,606 | 3,702 | 4,149 | 4,335 | 4,038 | 4,195 |
| 2005 | 4,390 | 3,909 | 4,826 | 4,422 | 5,172 | 4,376 | 4,032 | 4,072 | 3,661 | 3,375 | 3,685 | 2,076 |
| 2006 | 3,404 | 3,579 | 3,650 | 4,121 | 4,376 | 4,276 | 4,270 | 3,736 | 3,778 | 3,940 | 4,234 | 4,246 |
| 2007 | 4,326 | 3,381 | 4,607 | 4,788 | 4,464 | 4,925 | 4,781 | 4,951 | 4,371 | 4,584 | 4,839 | 5,075 |
| 2008 | 5,780 | 4,871 | 5,869 | 5,248 | 5,710 | 5,668 | 4,596 | 5,387 | 4,121 | 6,227 | 5,528 | 3,935 |
| 2009 | 4,097 | 4,883 | 6,881 | 6,391 | 7,073 | 6,514 | 6,729 | 6,727 | 7,188 | 7,475 | 7,251 | 8,131 |
| 2010 | 7,580 | 7,281 | 7,807 | 8,066 | 8,280 | 7,851 | 7,627 | 8,216 | 7,939 | 8,203 | 8,896 | 8,375 |
| 2011 | 8,406 | 7,957 | 8,796 | 8,025 | 9,167 | 8,448 | 8,199 | 8,237 | 7,816 | 8,764 | 9,514 | 10,385 |
| 2012 | 10,581 | 8,837 | 9,727 | 9,257 | 8,853 | 7,885 | 7,419 | 7,840 | 8,118 | 8,158 | 7,442 | 6,532 |
| 2013 | 5,010 | 3,965 | 5,618 | 5,922 | 6,229 | 4,783 | 5,106 | 4,950 | 6,429 | 6,437 | 6,716 | 5,033 |
| 2014 | 5,639 | 5,819 | 6,014 | 5,548 | 7,057 | 6,551 | 7,174 | 6,405 | 6,300 | 6,555 | 5,663 | 5,003 |
| 2015 | 4,416 | 3,583 | 5,543 | 5,016 | 5,745 | 5,654 | 6,237 | 5,749 | 6,125 | 6,630 | 7,665 | 7,276 |
| 2016 | 7,420 | 7,029 | 8,780 | 10,634 | 10,765 | 11,010 | 11,717 | 8,771 | 8,142 | 10,196 | 9,812 | 8,363 |
| 2017 | 9,084 | 9,447 | 10,996 | 10,126 | 11,417 | 11,302 | 11,452 | 11,779 | 11,161 | 13,708 | 14,350 | 13,810 |
| 2018 | 10,944 | 11,069 | 13,340 | 12,035 | 13,602 | 11,958 | 12,762 | 12,805 | 12,503 | 13,797 | 13,415 | 10,685 |
| 2019 | 12,280 | 12,148 | 14,449 | 13,465 | 12,380 | 11,431 | 9,279 | 9,520 | 10,987 | 13,123 | 11,035 | 11,220 |
| 2020 | 11,895 | 10,173 | 11,433 | 9,038 | 12,432 | 14,341 | 15,269 | 15,938 | 13,630 | 12,436 | 10,381 | 12,232 |
| 2021 | 12,670 | 12,040 | 13,182 | 14,998 | 14,629 | 15,542 | 15,570 | 15,712 | 15,709 | 16,518 | 15,981 | 16,881 |
| 2022 | -- | -- | -- | -- | -- | -- | -- | -- | -- | -- | -- | -- |
| 2023 | -- | -- | -- | -- | -- | -- | -- | -- | -- | -- | -- | -- |
| 2024 | -- | |||||||||||
| - = No Data Reported; -- = Not Applicable; NA = Not Available; W = Withheld to avoid disclosure of individual company data. |
| Release Date: 3/29/2024 |
| Next Release Date: 4/30/2024 |