|
Download Data (XLS File) |
|
||||||||
|
||||||||
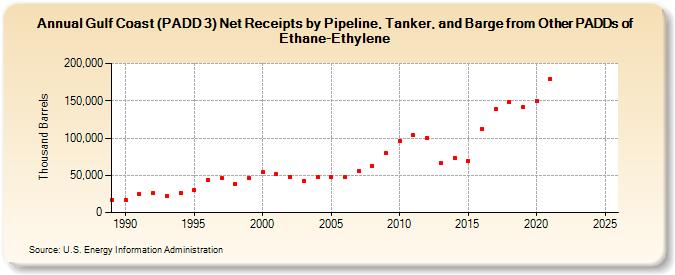
| Gulf Coast (PADD 3) Net Receipts by Pipeline, Tanker, and Barge from Other PADDs of Ethane-Ethylene (Thousand Barrels) | ||||||||
| Decade | Year-0 | Year-1 | Year-2 | Year-3 | Year-4 | Year-5 | Year-6 | Year-7 | Year-8 | Year-9 |
|---|---|---|---|---|---|---|---|---|---|---|
| 1980's | 17,328 | |||||||||
| 1990's | 16,523 | 24,851 | 26,547 | 21,950 | 26,603 | 30,103 | 43,790 | 46,213 | 38,799 | 45,866 |
| 2000's | 53,778 | 51,198 | 47,956 | 42,788 | 47,880 | 47,996 | 47,610 | 55,092 | 62,940 | 79,340 |
| 2010's | 96,121 | 103,714 | 100,649 | 66,198 | 73,728 | 69,639 | 112,639 | 138,632 | 148,915 | 141,317 |
| 2020's | 149,198 | 179,432 | -- | -- |
| - = No Data Reported; -- = Not Applicable; NA = Not Available; W = Withheld to avoid disclosure of individual company data. |
| Release Date: 3/29/2024 |
| Next Release Date: 8/30/2024 |