|
Download Data (XLS File) |
|
||||||||
|
||||||||
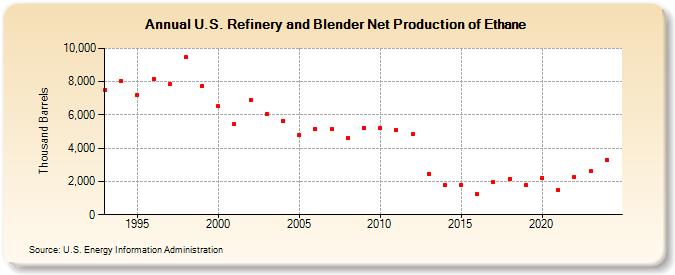
| U.S. Refinery and Blender Net Production of Ethane (Thousand Barrels) | ||||||||
| Decade | Year-0 | Year-1 | Year-2 | Year-3 | Year-4 | Year-5 | Year-6 | Year-7 | Year-8 | Year-9 |
|---|---|---|---|---|---|---|---|---|---|---|
| 1990's | 7,512 | 8,052 | 7,190 | 8,172 | 7,843 | 9,479 | 7,742 | |||
| 2000's | 6,510 | 5,457 | 6,923 | 6,054 | 5,663 | 4,784 | 5,170 | 5,145 | 4,608 | 5,229 |
| 2010's | 5,200 | 5,105 | 4,835 | 2,439 | 1,777 | 1,804 | 1,216 | 1,958 | 2,160 | 1,806 |
| 2020's | 2,236 | 1,505 | 2,274 | 2,605 |
| - = No Data Reported; -- = Not Applicable; NA = Not Available; W = Withheld to avoid disclosure of individual company data. |
| Release Date: 3/29/2024 |
| Next Release Date: 8/30/2024 |