|
Download Data (XLS File) |
|
||||||||
|
||||||||
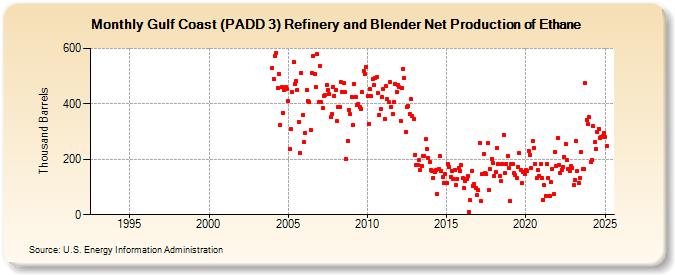
| Gulf Coast (PADD 3) Refinery and Blender Net Production of Ethane (Thousand Barrels) | ||||||||
| Year | Jan | Feb | Mar | Apr | May | Jun | Jul | Aug | Sep | Oct | Nov | Dec |
|---|---|---|---|---|---|---|---|---|---|---|---|---|
| 1993 | W | W | W | W | W | W | W | W | W | W | W | W |
| 1994 | W | W | W | W | W | W | W | W | W | W | W | W |
| 1995 | W | W | W | W | W | W | W | W | W | W | W | W |
| 1996 | W | W | W | W | W | W | W | W | W | W | W | W |
| 1997 | W | W | W | W | W | W | W | W | W | W | W | W |
| 1998 | W | W | W | W | W | W | W | W | W | W | W | W |
| 1999 | W | W | W | W | W | W | W | W | W | W | W | W |
| 2000 | W | W | W | W | W | W | W | W | W | W | W | W |
| 2001 | W | W | W | W | W | W | W | W | W | W | W | W |
| 2002 | W | W | W | W | W | W | W | W | W | W | W | W |
| 2003 | W | W | W | W | W | W | W | W | W | W | W | W |
| 2004 | 531 | 490 | 573 | 585 | 458 | 508 | 325 | 460 | 368 | 451 | 460 | 453 |
| 2005 | 410 | 237 | 308 | 443 | 550 | 472 | 482 | 450 | 335 | 224 | 513 | 360 |
| 2006 | 261 | 296 | 451 | 412 | 405 | 306 | 513 | 573 | 509 | 460 | 579 | 405 |
| 2007 | 538 | 405 | 385 | 428 | 431 | 469 | 451 | 434 | 352 | 362 | 461 | 429 |
| 2008 | 451 | 338 | 389 | 387 | 477 | 441 | 475 | 442 | 201 | 267 | 378 | 362 |
| 2009 | 426 | 322 | 472 | 425 | 394 | 400 | 389 | 383 | 441 | 520 | 507 | 532 |
| 2010 | 427 | 329 | 453 | 428 | 489 | 467 | 494 | 497 | 440 | 359 | 380 | 425 |
| 2011 | 453 | 346 | 463 | 416 | 406 | 478 | 388 | 364 | 408 | 471 | 443 | 469 |
| 2012 | 460 | 339 | 456 | 526 | 493 | 300 | 388 | 392 | 364 | 416 | 355 | 346 |
| 2013 | 217 | 180 | 178 | 198 | 160 | 177 | 211 | 212 | 272 | 238 | 206 | 190 |
| 2014 | 162 | 158 | 134 | 153 | 161 | 75 | 166 | 211 | 157 | 136 | 116 | 148 |
| 2015 | 114 | 184 | 171 | 137 | 158 | 130 | 163 | 108 | 130 | 169 | 159 | 180 |
| 2016 | 132 | 96 | 120 | 130 | 139 | 8 | 52 | 159 | 104 | 109 | 96 | 71 |
| 2017 | 88 | 259 | 48 | 148 | 219 | 151 | 147 | 257 | 90 | 164 | 202 | 185 |
| 2018 | 141 | 153 | 242 | 182 | 138 | 121 | 183 | 289 | 149 | 184 | 211 | 167 |
| 2019 | 49 | 183 | 182 | 150 | 144 | 131 | 173 | 221 | 160 | 113 | 154 | 146 |
| 2020 | 162 | 158 | 230 | 215 | 168 | 265 | 242 | 183 | 132 | 161 | 138 | 182 |
| 2021 | 131 | 54 | 107 | 69 | 184 | 133 | 68 | 117 | 166 | 75 | 225 | 176 |
| 2022 | 278 | 181 | 149 | 163 | 172 | 210 | 256 | 197 | 166 | 158 | 174 | 170 |
| 2023 | 106 | 127 | 265 | 156 | 116 | 134 | 226 | 166 | 166 | 475 | 342 | 326 |
| 2024 | 351 | 190 | 197 | 320 | ||||||||
| - = No Data Reported; -- = Not Applicable; NA = Not Available; W = Withheld to avoid disclosure of individual company data. |
| Release Date: 6/28/2024 |
| Next Release Date: 7/31/2024 |