|
Download Data (XLS File) |
|
||||||||
|
||||||||
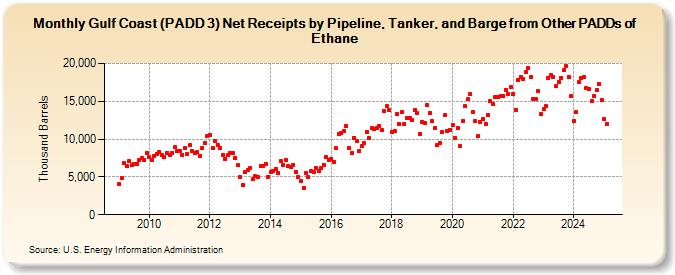
| Gulf Coast (PADD 3) Net Receipts by Pipeline, Tanker, and Barge from Other PADDs of Ethane (Thousand Barrels) | ||||||||
| Year | Jan | Feb | Mar | Apr | May | Jun | Jul | Aug | Sep | Oct | Nov | Dec |
|---|---|---|---|---|---|---|---|---|---|---|---|---|
| 2009 | 4,097 | 4,883 | 6,881 | 6,391 | 7,073 | 6,514 | 6,729 | 6,727 | 7,188 | 7,475 | 7,251 | 8,131 |
| 2010 | 7,580 | 7,281 | 7,807 | 8,066 | 8,280 | 7,851 | 7,627 | 8,216 | 7,939 | 8,203 | 8,896 | 8,375 |
| 2011 | 8,406 | 7,957 | 8,796 | 8,025 | 9,167 | 8,448 | 8,199 | 8,237 | 7,816 | 8,764 | 9,514 | 10,385 |
| 2012 | 10,581 | 8,837 | 9,727 | 9,257 | 8,853 | 7,885 | 7,419 | 7,840 | 8,118 | 8,158 | 7,442 | 6,532 |
| 2013 | 5,010 | 3,965 | 5,618 | 5,922 | 6,229 | 4,783 | 5,106 | 4,950 | 6,429 | 6,437 | 6,716 | 5,033 |
| 2014 | 5,639 | 5,819 | 6,014 | 5,548 | 7,057 | 6,551 | 7,174 | 6,405 | 6,300 | 6,555 | 5,663 | 5,003 |
| 2015 | 4,416 | 3,583 | 5,543 | 5,016 | 5,745 | 5,654 | 6,237 | 5,749 | 6,125 | 6,630 | 7,665 | 7,276 |
| 2016 | 7,420 | 7,029 | 8,780 | 10,634 | 10,765 | 11,010 | 11,717 | 8,771 | 8,142 | 10,196 | 9,812 | 8,363 |
| 2017 | 9,084 | 9,447 | 10,996 | 10,126 | 11,417 | 11,302 | 11,452 | 11,779 | 11,161 | 13,708 | 14,350 | 13,810 |
| 2018 | 10,944 | 11,069 | 13,340 | 12,035 | 13,602 | 11,958 | 12,762 | 12,805 | 12,503 | 13,797 | 13,415 | 10,685 |
| 2019 | 12,280 | 12,148 | 14,449 | 13,465 | 12,380 | 11,431 | 9,279 | 9,520 | 10,987 | 13,123 | 11,035 | 11,220 |
| 2020 | 11,895 | 10,173 | 11,433 | 9,038 | 12,432 | 14,341 | 15,269 | 15,938 | 13,630 | 12,436 | 10,381 | 12,232 |
| 2021 | 12,670 | 12,040 | 13,182 | 14,998 | 14,629 | 15,542 | 15,570 | 15,712 | 15,709 | 16,518 | 15,981 | 16,881 |
| 2022 | 15,953 | 13,901 | 17,804 | 18,177 | 17,928 | 18,840 | 19,454 | 18,240 | 15,320 | 15,266 | 16,337 | 13,317 |
| 2023 | 13,934 | 14,399 | 18,141 | 18,463 | 18,248 | 16,970 | 17,506 | 18,122 | 19,083 | 19,652 | 18,256 | 15,734 |
| 2024 | 12,421 | |||||||||||
| - = No Data Reported; -- = Not Applicable; NA = Not Available; W = Withheld to avoid disclosure of individual company data. |
| Release Date: 3/29/2024 |
| Next Release Date: 4/30/2024 |