|
Download Data (XLS File) |
|
||||||||
|
||||||||
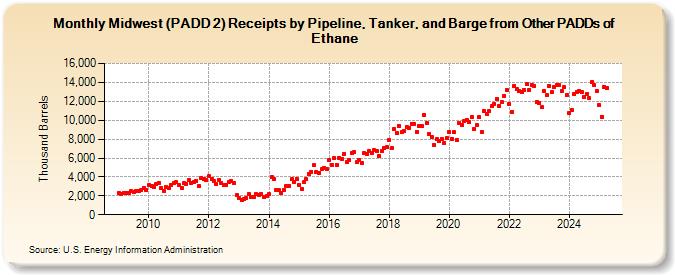
| Midwest (PADD 2) Receipts by Pipeline, Tanker, and Barge from Other PADDs of Ethane (Thousand Barrels) | ||||||||
| Year | Jan | Feb | Mar | Apr | May | Jun | Jul | Aug | Sep | Oct | Nov | Dec |
|---|---|---|---|---|---|---|---|---|---|---|---|---|
| 2009 | 2,314 | 2,202 | 2,343 | 2,301 | 2,327 | 2,461 | 2,399 | 2,524 | 2,507 | 2,637 | 2,847 | 2,627 |
| 2010 | 3,128 | 3,066 | 2,971 | 3,200 | 3,377 | 2,806 | 2,514 | 2,898 | 2,860 | 3,142 | 3,364 | 3,410 |
| 2011 | 3,127 | 2,843 | 3,317 | 3,297 | 3,621 | 3,363 | 3,463 | 3,585 | 3,016 | 3,833 | 3,786 | 3,689 |
| 2012 | 4,068 | 3,754 | 3,575 | 3,200 | 3,649 | 3,304 | 3,139 | 3,144 | 3,488 | 3,546 | 3,369 | 2,046 |
| 2013 | 1,747 | 1,546 | 1,661 | 1,728 | 2,173 | 1,903 | 1,926 | 2,145 | 2,056 | 2,150 | 1,902 | 1,957 |
| 2014 | 2,157 | 3,969 | 3,751 | 2,593 | 2,578 | 2,336 | 2,632 | 3,008 | 3,024 | 3,731 | 3,491 | 3,811 |
| 2015 | 3,177 | 2,737 | 3,419 | 3,744 | 4,270 | 4,566 | 5,220 | 4,503 | 4,435 | 4,808 | 4,928 | 4,860 |
| 2016 | 5,745 | 5,296 | 5,950 | 5,302 | 6,027 | 5,938 | 6,467 | 5,553 | 5,834 | 6,536 | 6,629 | 5,526 |
| 2017 | 5,768 | 5,489 | 6,483 | 6,434 | 6,765 | 6,523 | 6,797 | 6,701 | 6,222 | 6,747 | 7,105 | 7,120 |
| 2018 | 7,860 | 7,060 | 9,050 | 8,608 | 9,434 | 8,709 | 8,841 | 9,243 | 9,185 | 9,637 | 9,613 | 8,799 |
| 2019 | 9,384 | 9,379 | 10,546 | 9,680 | 8,564 | 8,185 | 7,402 | 7,982 | 7,767 | 8,048 | 7,590 | 8,090 |
| 2020 | 8,750 | 8,050 | 8,702 | 7,920 | 9,724 | 9,500 | 9,961 | 10,003 | 9,772 | 10,363 | 9,059 | 9,470 |
| 2021 | 10,333 | 8,771 | 10,995 | 10,667 | 10,946 | 11,471 | 11,765 | 12,282 | 11,533 | 11,874 | 12,579 | 13,206 |
| 2022 | 11,712 | 10,908 | 13,662 | 13,313 | 13,104 | 12,934 | 13,240 | 13,811 | 13,185 | 13,765 | 13,650 | 11,921 |
| 2023 | 11,786 | 11,351 | 13,064 | 12,622 | 13,618 | 12,957 | 13,493 | 13,723 | 13,726 | 13,085 | 13,460 | 12,682 |
| 2024 | 10,714 | |||||||||||
| - = No Data Reported; -- = Not Applicable; NA = Not Available; W = Withheld to avoid disclosure of individual company data. |
| Release Date: 3/29/2024 |
| Next Release Date: 4/30/2024 |