|
Download Data (XLS File) |
|
||||||||
|
||||||||
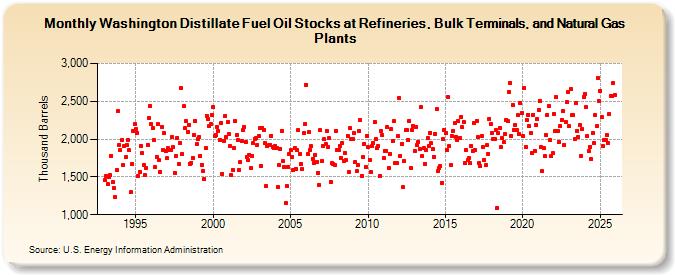
| Washington Distillate Fuel Oil Stocks at Refineries, Bulk Terminals, and Natural Gas Plants (Thousand Barrels) | ||||||||
| Year | Jan | Feb | Mar | Apr | May | Jun | Jul | Aug | Sep | Oct | Nov | Dec |
|---|---|---|---|---|---|---|---|---|---|---|---|---|
| 1993 | 1,453 | 1,514 | 1,404 | 1,493 | 1,520 | 1,778 | 1,429 | 1,352 | 1,230 | 1,595 | 2,367 | 1,924 |
| 1994 | 1,854 | 1,986 | 1,657 | 1,910 | 1,760 | 1,928 | 1,985 | 1,850 | 1,295 | 1,668 | 2,111 | 2,199 |
| 1995 | 2,134 | 2,079 | 1,512 | 1,565 | 1,915 | 1,814 | 1,651 | 1,528 | 1,617 | 1,926 | 2,273 | 2,441 |
| 1996 | 2,196 | 2,148 | 1,987 | 1,629 | 1,769 | 2,194 | 1,718 | 1,567 | 2,161 | 1,861 | 2,080 | 1,837 |
| 1997 | 1,748 | 1,877 | 1,850 | 1,862 | 2,028 | 1,892 | 1,557 | 1,776 | 2,021 | 1,673 | 1,952 | 2,670 |
| 1998 | 1,806 | 2,432 | 2,142 | 2,233 | 2,094 | 2,192 | 1,677 | 1,688 | 1,754 | 2,057 | 2,244 | 1,938 |
| 1999 | 1,995 | 2,028 | 1,783 | 1,661 | 1,584 | 1,469 | 1,879 | 2,310 | 2,269 | 2,172 | 2,197 | 2,323 |
| 2000 | 2,423 | 2,040 | 2,053 | 2,160 | 2,105 | 1,986 | 2,211 | 1,544 | 1,978 | 2,302 | 2,034 | 2,221 |
| 2001 | 2,061 | 1,908 | 1,526 | 1,595 | 1,884 | 2,242 | 2,057 | 1,988 | 1,594 | 1,699 | 1,980 | 2,120 |
| 2002 | 2,160 | 1,956 | 1,767 | 1,720 | 1,791 | 1,616 | 1,777 | 1,950 | 1,999 | 2,008 | 1,926 | 2,035 |
| 2003 | 2,142 | 1,648 | 2,153 | 2,124 | 1,950 | 1,380 | 1,908 | 1,924 | 1,928 | 2,045 | 1,893 | 1,876 |
| 2004 | 1,910 | 1,879 | 1,368 | 1,657 | 1,874 | 2,113 | 1,705 | 1,630 | 1,153 | 1,378 | 1,629 | 1,802 |
| 2005 | 1,851 | 1,768 | 1,592 | 1,879 | 1,605 | 1,852 | 2,115 | 1,808 | 1,674 | 1,603 | 2,082 | 2,195 |
| 2006 | 2,719 | 1,800 | 2,094 | 1,858 | 1,904 | 1,741 | 1,690 | 1,795 | 1,700 | 1,556 | 1,397 | 2,117 |
| 2007 | 1,708 | 1,912 | 1,995 | 1,931 | 2,112 | 1,899 | 2,010 | 1,430 | 1,681 | 1,675 | 1,657 | 2,108 |
| 2008 | 1,862 | 1,858 | 1,911 | 1,756 | 1,953 | 1,716 | 1,819 | 1,724 | 2,042 | 1,561 | 2,144 | 2,006 |
| 2009 | 1,997 | 2,079 | 1,697 | 1,577 | 1,656 | 2,102 | 2,247 | 1,517 | 1,760 | 1,936 | 1,635 | 2,047 |
| 2010 | 1,889 | 1,727 | 1,571 | 1,914 | 1,946 | 2,228 | 2,001 | 1,883 | 1,907 | 1,513 | 2,105 | 2,054 |
| 2011 | 1,754 | 1,848 | 1,844 | 2,157 | 1,617 | 1,808 | 2,129 | 1,971 | 2,233 | 1,690 | 1,680 | 2,044 |
| 2012 | 2,542 | 1,780 | 1,939 | 1,361 | 1,713 | 2,115 | 2,116 | 1,989 | 2,239 | 1,622 | 2,123 | 2,175 |
| 2013 | 1,842 | 2,166 | 1,916 | 1,968 | 1,867 | 2,423 | 1,779 | 1,884 | 1,672 | 1,854 | 2,013 | 1,904 |
| 2014 | 2,084 | 1,945 | 1,863 | 1,768 | 2,065 | 2,397 | 1,577 | 1,619 | 1,643 | 1,424 | 1,997 | 2,125 |
| 2015 | 2,084 | 1,853 | 2,553 | 1,903 | 1,654 | 2,041 | 2,110 | 2,209 | 2,028 | 1,986 | 2,240 | 2,016 |
| 2016 | 2,296 | 2,155 | 2,230 | 1,681 | 1,854 | 1,720 | 1,744 | 1,679 | 1,910 | 1,849 | 2,216 | 1,851 |
| 2017 | 2,245 | 2,024 | 1,687 | 1,645 | 2,043 | 1,891 | 1,729 | 1,652 | 1,919 | 1,807 | 2,272 | 2,198 |
| 2018 | 2,082 | 2,007 | 1,999 | 2,123 | 1,092 | 2,083 | 2,149 | 1,895 | 2,008 | 1,958 | 2,073 | 2,258 |
| 2019 | 2,236 | 2,624 | 2,748 | 2,046 | 2,448 | 2,121 | 2,186 | 2,124 | 2,315 | 2,069 | 2,472 | 2,343 |
| 2020 | 2,038 | 2,675 | 1,899 | 2,255 | 2,322 | 2,172 | 2,077 | 1,821 | 2,322 | 1,847 | 2,183 | 2,263 |
| 2021 | 2,383 | 2,509 | 1,889 | 1,577 | 1,877 | 1,771 | 2,052 | 2,325 | 2,434 | 1,989 | 1,775 | 1,811 |
| 2022 | 2,338 | 2,113 | 2,556 | 2,109 | 1,967 | 2,168 | 2,254 | 2,365 | 1,924 | 2,224 | 2,487 | 2,622 |
| 2023 | 2,169 | 2,657 | 2,315 | 2,317 | 1,996 | 2,445 | 2,123 | 2,033 | 2,160 | 1,783 | 2,133 | 2,558 |
| 2024 | 2,599 | |||||||||||
| - = No Data Reported; -- = Not Applicable; NA = Not Available; W = Withheld to avoid disclosure of individual company data. |
| Release Date: 3/29/2024 |
| Next Release Date: 4/30/2024 |