|
Download Data (XLS File) |
|
||||||||
|
||||||||
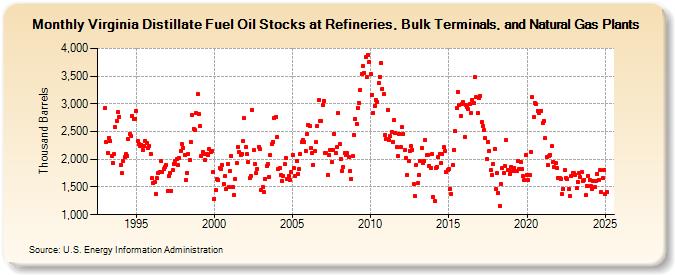
| Virginia Distillate Fuel Oil Stocks at Refineries, Bulk Terminals, and Natural Gas Plants (Thousand Barrels) | ||||||||
| Year | Jan | Feb | Mar | Apr | May | Jun | Jul | Aug | Sep | Oct | Nov | Dec |
|---|---|---|---|---|---|---|---|---|---|---|---|---|
| 1993 | 2,916 | 2,303 | 2,119 | 2,388 | 2,321 | 2,065 | 1,938 | 2,087 | 2,574 | 2,692 | 2,852 | 2,767 |
| 1994 | 1,893 | 1,745 | 1,969 | 2,040 | 2,087 | 2,067 | 2,370 | 2,456 | 2,419 | 2,781 | 2,732 | 2,725 |
| 1995 | 2,876 | 2,336 | 2,282 | 2,243 | 2,263 | 2,170 | 2,246 | 2,333 | 2,300 | 2,201 | 2,241 | 2,101 |
| 1996 | 1,654 | 1,580 | 1,585 | 1,378 | 1,654 | 1,754 | 1,778 | 1,963 | 1,764 | 1,829 | 1,863 | 1,896 |
| 1997 | 1,427 | 1,690 | 1,756 | 1,434 | 1,799 | 1,911 | 1,970 | 1,997 | 1,899 | 2,021 | 2,153 | 2,267 |
| 1998 | 2,207 | 2,082 | 1,619 | 1,760 | 2,093 | 1,984 | 2,316 | 2,797 | 2,555 | 2,528 | 2,836 | 3,172 |
| 1999 | 2,815 | 2,596 | 2,054 | 2,139 | 2,092 | 1,984 | 2,087 | 2,072 | 2,188 | 2,136 | 2,149 | 1,769 |
| 2000 | 1,289 | 1,441 | 1,646 | 1,626 | 1,838 | 1,826 | 1,897 | 1,562 | 1,694 | 1,458 | 1,909 | 1,502 |
| 2001 | 1,784 | 2,065 | 1,494 | 1,359 | 1,648 | 1,934 | 2,225 | 2,131 | 2,083 | 2,099 | 2,325 | 2,736 |
| 2002 | 2,214 | 2,089 | 1,955 | 1,657 | 1,697 | 2,891 | 2,162 | 1,916 | 1,747 | 1,828 | 2,230 | 2,184 |
| 2003 | 1,454 | 1,494 | 1,401 | 1,651 | 1,875 | 1,908 | 1,684 | 2,078 | 2,270 | 2,319 | 2,748 | 2,762 |
| 2004 | 2,401 | 1,831 | 1,844 | 1,714 | 1,616 | 1,702 | 1,907 | 2,030 | 1,645 | 1,704 | 1,627 | 1,778 |
| 2005 | 2,081 | 1,835 | 1,699 | 1,961 | 1,727 | 1,819 | 2,098 | 2,312 | 2,344 | 2,315 | 2,150 | 2,451 |
| 2006 | 2,627 | 2,607 | 2,199 | 2,111 | 1,905 | 2,147 | 2,303 | 2,599 | 3,062 | 2,693 | 2,695 | 2,975 |
| 2007 | 3,043 | 2,122 | 2,112 | 1,710 | 2,071 | 2,176 | 1,944 | 2,166 | 2,463 | 2,108 | 2,222 | 2,836 |
| 2008 | 2,270 | 1,997 | 1,794 | 1,864 | 2,115 | 2,070 | 2,106 | 2,047 | 1,792 | 1,645 | 2,056 | 2,438 |
| 2009 | 2,734 | 2,642 | 2,933 | 3,021 | 3,255 | 3,546 | 3,678 | 3,559 | 3,838 | 3,482 | 3,882 | 3,763 |
| 2010 | 3,539 | 3,166 | 2,835 | 2,967 | 3,068 | 3,041 | 3,382 | 3,491 | 3,739 | 3,274 | 3,174 | 2,441 |
| 2011 | 2,370 | 2,896 | 2,347 | 2,412 | 2,489 | 2,312 | 2,704 | 2,481 | 2,213 | 2,062 | 2,464 | 2,214 |
| 2012 | 2,575 | 2,464 | 2,159 | 2,024 | 1,725 | 1,963 | 2,157 | 2,231 | 2,175 | 1,554 | 1,332 | 1,902 |
| 2013 | 1,567 | 1,719 | 1,971 | 2,212 | 1,937 | 1,969 | 2,345 | 2,073 | 2,084 | 1,880 | 1,847 | 2,087 |
| 2014 | 1,321 | 1,240 | 1,839 | 1,863 | 2,039 | 2,104 | 1,935 | 2,100 | 2,213 | 2,150 | 1,770 | 1,808 |
| 2015 | 1,824 | 1,467 | 1,377 | 1,900 | 2,176 | 2,509 | 2,929 | 3,219 | 2,972 | 2,785 | 2,999 | 3,028 |
| 2016 | 2,405 | 2,977 | 2,940 | 2,905 | 3,005 | 2,837 | 3,074 | 3,011 | 3,478 | 3,118 | 2,834 | 3,099 |
| 2017 | 3,149 | 2,670 | 2,600 | 2,521 | 2,375 | 2,002 | 2,312 | 2,152 | 1,801 | 1,712 | 1,917 | 2,191 |
| 2018 | 1,455 | 1,745 | 1,389 | 1,163 | 1,560 | 1,847 | 1,754 | 1,874 | 2,339 | 1,814 | 1,814 | 1,737 |
| 2019 | 1,863 | 1,781 | 1,844 | 1,793 | 1,786 | 1,973 | 1,827 | 1,948 | 1,816 | 1,690 | 1,627 | 2,074 |
| 2020 | 1,724 | 1,624 | 1,719 | 2,132 | 3,116 | 2,757 | 3,016 | 2,989 | 2,878 | 2,842 | 2,865 | 2,878 |
| 2021 | 2,653 | 2,695 | 2,376 | 2,032 | 1,892 | 2,061 | 2,085 | 2,231 | 1,953 | 1,856 | 1,928 | 1,843 |
| 2022 | 1,669 | 1,660 | 1,649 | 1,377 | 1,469 | 1,799 | 1,666 | 1,637 | 1,459 | 1,344 | 1,690 | 1,758 |
| 2023 | 1,748 | 1,713 | 1,474 | 1,593 | 1,754 | 1,672 | 1,762 | 1,610 | 1,631 | 1,350 | 1,519 | 1,707 |
| 2024 | 1,634 | |||||||||||
| - = No Data Reported; -- = Not Applicable; NA = Not Available; W = Withheld to avoid disclosure of individual company data. |
| Release Date: 3/29/2024 |
| Next Release Date: 4/30/2024 |