|
Download Data (XLS File) |
|
||||||||
|
||||||||
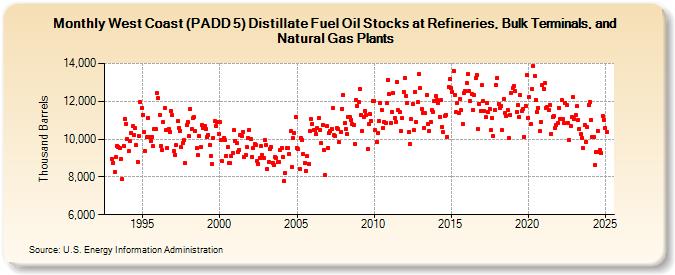
| West Coast (PADD 5) Distillate Fuel Oil Stocks at Refineries, Bulk Terminals, and Natural Gas Plants (Thousand Barrels) | ||||||||
| Year | Jan | Feb | Mar | Apr | May | Jun | Jul | Aug | Sep | Oct | Nov | Dec |
|---|---|---|---|---|---|---|---|---|---|---|---|---|
| 1993 | 8,963 | 8,755 | 8,265 | 9,050 | 9,640 | 9,596 | 9,524 | 8,965 | 7,871 | 9,644 | 11,056 | 10,817 |
| 1994 | 10,006 | 9,344 | 9,891 | 10,339 | 10,671 | 10,215 | 10,581 | 9,683 | 8,812 | 10,153 | 11,943 | 11,659 |
| 1995 | 11,276 | 10,378 | 9,354 | 10,093 | 11,122 | 10,131 | 9,908 | 10,137 | 9,621 | 10,512 | 10,508 | 12,418 |
| 1996 | 12,157 | 11,283 | 9,644 | 9,439 | 10,884 | 11,659 | 10,458 | 9,549 | 10,550 | 10,364 | 11,478 | 11,261 |
| 1997 | 9,346 | 9,183 | 9,674 | 10,957 | 10,597 | 10,454 | 9,556 | 9,782 | 9,930 | 8,726 | 10,737 | 10,901 |
| 1998 | 10,155 | 11,583 | 10,517 | 11,106 | 11,152 | 10,423 | 9,529 | 9,146 | 10,169 | 9,593 | 10,737 | 10,599 |
| 1999 | 10,708 | 10,538 | 10,108 | 10,222 | 9,700 | 9,111 | 8,691 | 10,036 | 10,933 | 10,682 | 10,920 | 10,293 |
| 2000 | 10,880 | 9,965 | 8,828 | 10,077 | 9,948 | 9,123 | 9,574 | 8,740 | 8,711 | 9,104 | 9,275 | 10,464 |
| 2001 | 9,921 | 9,791 | 9,330 | 9,438 | 10,242 | 10,150 | 10,379 | 9,067 | 9,178 | 9,558 | 10,065 | 10,469 |
| 2002 | 10,030 | 9,076 | 9,549 | 9,744 | 9,709 | 8,844 | 8,701 | 8,982 | 9,610 | 9,147 | 9,009 | 9,952 |
| 2003 | 9,691 | 8,431 | 8,809 | 9,485 | 9,572 | 8,761 | 8,623 | 9,061 | 9,026 | 8,788 | 8,800 | 9,428 |
| 2004 | 9,541 | 9,078 | 7,760 | 8,199 | 9,518 | 9,508 | 9,223 | 10,410 | 8,510 | 10,040 | 10,317 | 11,179 |
| 2005 | 9,521 | 9,452 | 8,414 | 10,072 | 9,978 | 9,199 | 8,739 | 8,327 | 9,100 | 8,685 | 10,403 | 11,086 |
| 2006 | 10,790 | 10,495 | 10,480 | 10,255 | 10,564 | 11,135 | 10,502 | 9,771 | 10,768 | 9,430 | 8,087 | 10,676 |
| 2007 | 9,554 | 10,320 | 10,428 | 10,551 | 11,623 | 10,195 | 10,148 | 10,564 | 10,536 | 9,851 | 10,396 | 11,606 |
| 2008 | 12,357 | 10,858 | 10,550 | 10,252 | 11,150 | 11,162 | 11,035 | 10,793 | 10,720 | 9,763 | 12,079 | 11,776 |
| 2009 | 11,965 | 12,659 | 11,290 | 10,432 | 11,169 | 11,508 | 11,273 | 9,464 | 10,783 | 11,328 | 10,952 | 12,015 |
| 2010 | 12,035 | 10,478 | 9,828 | 10,349 | 10,981 | 11,900 | 11,561 | 10,590 | 10,916 | 10,843 | 11,919 | 13,150 |
| 2011 | 12,375 | 10,870 | 11,442 | 12,418 | 11,106 | 10,916 | 13,016 | 11,525 | 11,437 | 10,426 | 11,112 | 12,494 |
| 2012 | 13,246 | 12,303 | 11,935 | 10,367 | 9,743 | 11,040 | 11,833 | 10,481 | 12,496 | 10,884 | 11,953 | 13,429 |
| 2013 | 12,678 | 11,601 | 11,402 | 10,588 | 11,365 | 12,326 | 10,796 | 10,425 | 10,927 | 11,555 | 11,437 | 12,033 |
| 2014 | 12,262 | 12,092 | 11,927 | 11,185 | 12,048 | 10,645 | 10,362 | 11,219 | 11,300 | 10,137 | 12,766 | 13,159 |
| 2015 | 12,700 | 12,508 | 13,617 | 12,339 | 11,417 | 11,935 | 11,385 | 12,122 | 11,536 | 10,791 | 12,427 | 12,536 |
| 2016 | 12,988 | 13,419 | 12,518 | 11,999 | 12,396 | 11,562 | 12,314 | 13,217 | 13,378 | 10,542 | 11,871 | 11,500 |
| 2017 | 12,848 | 12,026 | 11,491 | 11,143 | 11,890 | 11,457 | 11,615 | 10,460 | 11,112 | 10,157 | 11,562 | 12,862 |
| 2018 | 13,255 | 11,847 | 11,633 | 11,760 | 10,457 | 12,130 | 11,379 | 11,226 | 11,558 | 10,033 | 11,285 | 12,440 |
| 2019 | 12,705 | 12,817 | 12,530 | 11,432 | 11,803 | 11,159 | 12,332 | 11,461 | 11,584 | 10,135 | 11,761 | 13,376 |
| 2020 | 11,126 | 12,217 | 10,773 | 12,659 | 13,845 | 13,350 | 12,084 | 11,433 | 11,653 | 10,414 | 10,913 | 12,838 |
| 2021 | 12,664 | 12,943 | 11,638 | 11,684 | 11,547 | 11,810 | 10,293 | 11,189 | 11,209 | 10,568 | 10,738 | 10,847 |
| 2022 | 11,646 | 11,085 | 12,050 | 11,065 | 10,842 | 11,935 | 11,794 | 10,877 | 9,947 | 10,709 | 11,160 | 12,211 |
| 2023 | 11,127 | 11,361 | 11,884 | 11,078 | 10,556 | 10,382 | 10,126 | 9,516 | 10,720 | 9,881 | 10,616 | 11,813 |
| 2024 | 11,970 | |||||||||||
| - = No Data Reported; -- = Not Applicable; NA = Not Available; W = Withheld to avoid disclosure of individual company data. |
| Release Date: 3/29/2024 |
| Next Release Date: 4/30/2024 |