|
Download Data (XLS File) |
|
||||||||
|
||||||||
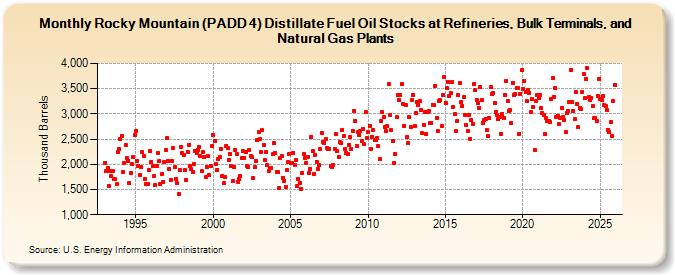
| Rocky Mountain (PADD 4) Distillate Fuel Oil Stocks at Refineries, Bulk Terminals, and Natural Gas Plants (Thousand Barrels) | ||||||||
| Year | Jan | Feb | Mar | Apr | May | Jun | Jul | Aug | Sep | Oct | Nov | Dec |
|---|---|---|---|---|---|---|---|---|---|---|---|---|
| 1993 | 2,029 | 1,871 | 1,932 | 1,578 | 1,861 | 1,771 | 1,871 | 1,715 | 1,699 | 1,603 | 2,238 | 2,304 |
| 1994 | 2,505 | 2,570 | 1,854 | 2,025 | 2,377 | 2,131 | 2,072 | 1,630 | 1,831 | 2,012 | 2,140 | 2,572 |
| 1995 | 2,653 | 2,066 | 1,972 | 1,779 | 1,956 | 2,242 | 2,156 | 1,704 | 1,617 | 1,601 | 1,884 | 2,262 |
| 1996 | 2,052 | 1,960 | 1,761 | 1,584 | 1,971 | 2,226 | 2,065 | 1,607 | 1,813 | 1,657 | 2,037 | 2,283 |
| 1997 | 2,515 | 2,065 | 1,906 | 1,686 | 2,067 | 2,326 | 1,939 | 1,711 | 1,623 | 1,405 | 1,893 | 2,349 |
| 1998 | 2,224 | 2,176 | 1,887 | 1,698 | 2,253 | 2,381 | 1,964 | 1,897 | 1,848 | 2,010 | 2,261 | 2,221 |
| 1999 | 2,284 | 2,348 | 2,160 | 1,858 | 2,248 | 2,142 | 1,752 | 1,948 | 2,157 | 1,786 | 1,957 | 2,354 |
| 2000 | 2,582 | 2,467 | 2,010 | 1,890 | 2,107 | 2,136 | 2,311 | 1,775 | 1,622 | 1,752 | 2,371 | 2,317 |
| 2001 | 2,091 | 2,211 | 1,968 | 1,666 | 1,945 | 2,290 | 2,198 | 1,655 | 1,712 | 1,775 | 2,122 | 2,257 |
| 2002 | 2,123 | 2,252 | 1,970 | 1,949 | 2,279 | 2,174 | 2,137 | 1,736 | 1,937 | 2,066 | 2,477 | 2,649 |
| 2003 | 2,493 | 2,247 | 2,673 | 2,384 | 2,087 | 2,240 | 1,985 | 1,863 | 1,918 | 1,918 | 2,197 | 2,415 |
| 2004 | 2,217 | 1,850 | 1,842 | 1,538 | 2,131 | 2,160 | 1,735 | 1,674 | 1,555 | 1,891 | 2,050 | 2,213 |
| 2005 | 2,030 | 2,021 | 2,226 | 1,981 | 2,095 | 1,560 | 1,716 | 1,637 | 1,516 | 1,830 | 2,211 | 2,134 |
| 2006 | 2,032 | 2,145 | 1,831 | 1,909 | 2,543 | 2,261 | 1,806 | 2,194 | 2,054 | 1,910 | 1,980 | 2,307 |
| 2007 | 2,619 | 2,448 | 2,429 | 2,505 | 2,317 | 2,302 | 2,310 | 1,964 | 1,942 | 1,982 | 2,305 | 2,595 |
| 2008 | 2,262 | 2,154 | 2,442 | 2,432 | 2,684 | 2,561 | 2,304 | 2,231 | 2,203 | 2,392 | 2,533 | 2,307 |
| 2009 | 2,666 | 3,061 | 2,864 | 2,371 | 2,631 | 2,580 | 2,668 | 2,469 | 2,702 | 2,402 | 3,031 | 2,513 |
| 2010 | 2,636 | 2,760 | 2,312 | 2,550 | 2,689 | 2,476 | 2,490 | 2,523 | 2,370 | 2,099 | 2,855 | 3,030 |
| 2011 | 2,943 | 2,742 | 2,661 | 2,757 | 3,593 | 2,980 | 2,675 | 2,471 | 2,027 | 2,202 | 2,930 | 3,381 |
| 2012 | 3,274 | 3,375 | 3,591 | 3,200 | 2,766 | 3,183 | 2,535 | 2,432 | 2,933 | 2,732 | 3,279 | 3,378 |
| 2013 | 2,757 | 3,010 | 3,230 | 3,173 | 3,260 | 3,085 | 2,612 | 2,787 | 3,032 | 2,597 | 3,043 | 3,059 |
| 2014 | 2,827 | 2,813 | 3,182 | 3,169 | 3,560 | 2,924 | 2,656 | 3,258 | 3,268 | 2,759 | 3,384 | 3,739 |
| 2015 | 3,225 | 3,512 | 3,641 | 3,355 | 3,405 | 3,642 | 3,139 | 2,994 | 2,657 | 2,850 | 3,371 | 3,620 |
| 2016 | 3,232 | 3,159 | 3,329 | 2,982 | 2,776 | 2,663 | 2,983 | 2,507 | 2,869 | 2,800 | 3,588 | 3,468 |
| 2017 | 3,284 | 3,218 | 3,123 | 3,534 | 3,274 | 2,829 | 2,870 | 2,904 | 2,679 | 2,568 | 2,913 | 3,540 |
| 2018 | 3,400 | 3,419 | 3,208 | 3,042 | 2,970 | 2,903 | 2,946 | 2,610 | 3,007 | 2,920 | 3,377 | 3,652 |
| 2019 | 3,262 | 3,056 | 3,072 | 2,814 | 3,614 | 3,371 | 3,385 | 3,518 | 3,511 | 2,605 | 3,401 | 3,867 |
| 2020 | 3,498 | 3,653 | 3,426 | 3,255 | 3,465 | 3,420 | 3,034 | 3,291 | 3,134 | 2,284 | 3,262 | 3,368 |
| 2021 | 3,306 | 3,382 | 3,121 | 3,018 | 2,980 | 2,598 | 2,909 | 2,853 | 2,860 | 2,835 | 3,302 | 3,715 |
| 2022 | 3,344 | 3,510 | 2,948 | 2,967 | 2,795 | 2,922 | 3,119 | 2,934 | 2,887 | 2,645 | 3,014 | 3,059 |
| 2023 | 3,221 | 3,884 | 3,216 | 3,056 | 2,890 | 3,414 | 3,205 | 2,761 | 3,106 | 3,094 | 3,444 | 3,784 |
| 2024 | 3,294 | |||||||||||
| - = No Data Reported; -- = Not Applicable; NA = Not Available; W = Withheld to avoid disclosure of individual company data. |
| Release Date: 3/29/2024 |
| Next Release Date: 4/30/2024 |