|
Download Data (XLS File) |
|
||||||||
|
||||||||
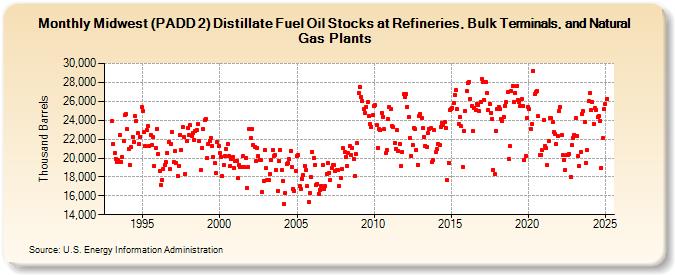
| Midwest (PADD 2) Distillate Fuel Oil Stocks at Refineries, Bulk Terminals, and Natural Gas Plants (Thousand Barrels) | ||||||||
| Year | Jan | Feb | Mar | Apr | May | Jun | Jul | Aug | Sep | Oct | Nov | Dec |
|---|---|---|---|---|---|---|---|---|---|---|---|---|
| 1993 | 23,914 | 21,464 | 20,563 | 19,944 | 19,564 | 19,779 | 22,433 | 19,561 | 20,114 | 21,774 | 24,524 | 24,616 |
| 1994 | 23,045 | 20,994 | 19,273 | 21,150 | 22,225 | 21,730 | 24,410 | 23,894 | 22,617 | 21,490 | 22,270 | 25,388 |
| 1995 | 25,017 | 22,745 | 21,251 | 22,941 | 23,368 | 21,243 | 22,473 | 21,349 | 22,205 | 19,143 | 21,058 | 23,083 |
| 1996 | 20,445 | 18,613 | 17,180 | 17,666 | 18,879 | 19,304 | 19,568 | 20,560 | 21,733 | 18,787 | 21,501 | 22,743 |
| 1997 | 19,574 | 20,731 | 19,447 | 18,147 | 19,185 | 22,447 | 20,821 | 23,231 | 22,217 | 18,342 | 21,776 | 23,176 |
| 1998 | 22,398 | 23,457 | 22,294 | 22,681 | 21,956 | 22,901 | 22,968 | 23,643 | 21,775 | 18,718 | 21,072 | 23,020 |
| 1999 | 23,979 | 24,114 | 20,032 | 21,500 | 21,754 | 22,151 | 21,306 | 20,095 | 19,464 | 18,407 | 21,675 | 21,260 |
| 2000 | 20,526 | 20,068 | 18,101 | 19,263 | 20,164 | 20,969 | 21,461 | 20,177 | 19,185 | 19,876 | 20,143 | 18,917 |
| 2001 | 19,673 | 19,710 | 17,836 | 19,227 | 19,100 | 19,059 | 20,172 | 18,998 | 19,978 | 16,832 | 19,005 | 23,067 |
| 2002 | 22,075 | 23,058 | 21,415 | 21,191 | 19,707 | 21,068 | 20,188 | 19,797 | 19,769 | 16,423 | 17,617 | 20,838 |
| 2003 | 18,939 | 17,634 | 17,675 | 18,313 | 19,746 | 20,859 | 20,258 | 20,339 | 18,706 | 16,555 | 19,714 | 20,860 |
| 2004 | 18,721 | 17,554 | 15,099 | 16,254 | 19,349 | 19,506 | 19,854 | 20,773 | 19,068 | 16,745 | 16,541 | 18,651 |
| 2005 | 20,172 | 20,336 | 17,008 | 16,771 | 17,823 | 18,190 | 19,200 | 18,737 | 16,991 | 15,367 | 16,329 | 17,945 |
| 2006 | 20,675 | 19,999 | 19,290 | 17,130 | 17,261 | 16,210 | 16,626 | 17,065 | 19,209 | 16,729 | 16,994 | 18,344 |
| 2007 | 19,462 | 18,466 | 17,710 | 18,958 | 19,257 | 19,223 | 18,600 | 18,683 | 18,725 | 17,050 | 17,926 | 18,873 |
| 2008 | 21,057 | 20,633 | 20,154 | 19,190 | 20,485 | 21,256 | 20,323 | 21,069 | 19,932 | 18,109 | 20,379 | 21,537 |
| 2009 | 26,909 | 27,486 | 26,486 | 26,038 | 25,135 | 24,759 | 25,431 | 25,877 | 24,442 | 23,562 | 23,320 | 24,509 |
| 2010 | 25,463 | 25,571 | 23,506 | 21,070 | 23,023 | 22,955 | 24,776 | 24,386 | 23,024 | 20,484 | 20,834 | 24,094 |
| 2011 | 25,393 | 25,167 | 23,410 | 23,231 | 21,603 | 20,982 | 22,911 | 20,716 | 21,479 | 19,168 | 20,675 | 26,733 |
| 2012 | 26,412 | 26,777 | 25,433 | 24,337 | 22,166 | 20,232 | 21,384 | 23,175 | 23,038 | 20,875 | 19,304 | 24,414 |
| 2013 | 24,691 | 24,208 | 23,159 | 22,274 | 21,283 | 21,202 | 22,600 | 23,083 | 23,128 | 19,541 | 19,757 | 22,946 |
| 2014 | 20,590 | 20,904 | 21,529 | 21,352 | 23,233 | 23,738 | 23,448 | 23,800 | 23,155 | 17,631 | 19,514 | 25,057 |
| 2015 | 25,172 | 25,336 | 25,814 | 26,713 | 27,195 | 25,178 | 23,644 | 24,370 | 23,342 | 19,077 | 22,826 | 25,004 |
| 2016 | 27,066 | 27,886 | 28,091 | 26,274 | 25,536 | 22,856 | 25,337 | 25,041 | 25,728 | 25,630 | 24,929 | 25,926 |
| 2017 | 28,374 | 27,992 | 26,135 | 28,073 | 26,842 | 25,124 | 25,757 | 24,735 | 24,134 | 18,745 | 18,276 | 22,835 |
| 2018 | 25,186 | 25,360 | 25,186 | 24,106 | 23,939 | 24,380 | 25,548 | 25,938 | 26,987 | 19,849 | 21,230 | 27,097 |
| 2019 | 27,656 | 25,974 | 26,911 | 27,576 | 26,105 | 25,955 | 25,498 | 26,212 | 25,504 | 19,793 | 20,188 | 24,209 |
| 2020 | 25,402 | 25,171 | 23,087 | 23,622 | 29,179 | 26,719 | 27,025 | 27,041 | 24,392 | 20,292 | 20,339 | 20,813 |
| 2021 | 24,009 | 21,268 | 21,043 | 19,209 | 21,841 | 24,256 | 24,198 | 23,780 | 22,699 | 22,555 | 21,467 | 22,309 |
| 2022 | 25,009 | 25,352 | 22,422 | 20,276 | 19,801 | 18,762 | 20,304 | 20,363 | 20,433 | 17,993 | 21,323 | 22,138 |
| 2023 | 22,418 | 24,126 | 22,335 | 20,199 | 19,161 | 20,613 | 24,671 | 24,955 | 23,860 | 19,537 | 20,832 | 26,030 |
| 2024 | 26,866 | |||||||||||
| - = No Data Reported; -- = Not Applicable; NA = Not Available; W = Withheld to avoid disclosure of individual company data. |
| Release Date: 3/29/2024 |
| Next Release Date: 4/30/2024 |