|
Download Data (XLS File) |
|
||||||||
|
||||||||
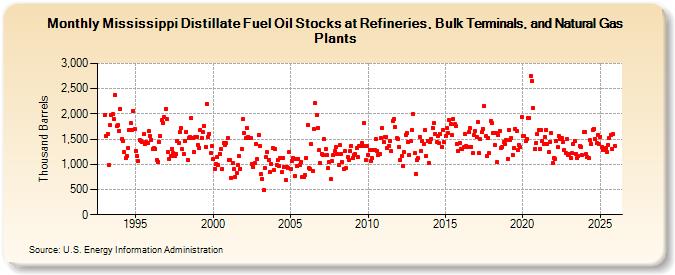
| Mississippi Distillate Fuel Oil Stocks at Refineries, Bulk Terminals, and Natural Gas Plants (Thousand Barrels) | ||||||||
| Year | Jan | Feb | Mar | Apr | May | Jun | Jul | Aug | Sep | Oct | Nov | Dec |
|---|---|---|---|---|---|---|---|---|---|---|---|---|
| 1993 | 1,986 | 1,566 | 1,603 | 987 | 1,772 | 1,972 | 1,992 | 1,898 | 2,372 | 1,752 | 1,773 | 1,663 |
| 1994 | 2,102 | 1,496 | 1,467 | 1,236 | 1,124 | 1,170 | 1,329 | 1,685 | 1,813 | 1,687 | 2,055 | 1,705 |
| 1995 | 1,273 | 1,159 | 1,060 | 1,479 | 1,453 | 1,442 | 1,596 | 1,397 | 1,445 | 1,413 | 1,655 | 1,558 |
| 1996 | 1,491 | 1,311 | 1,314 | 1,310 | 1,082 | 1,049 | 1,449 | 1,559 | 1,869 | 1,817 | 1,936 | 2,105 |
| 1997 | 1,890 | 1,246 | 1,113 | 1,159 | 1,310 | 1,225 | 1,163 | 1,212 | 1,459 | 1,431 | 1,631 | 1,724 |
| 1998 | 1,294 | 1,208 | 1,460 | 1,647 | 1,094 | 1,516 | 1,546 | 1,919 | 1,513 | 1,243 | 1,542 | 1,532 |
| 1999 | 1,387 | 1,332 | 1,684 | 1,525 | 1,642 | 1,761 | 1,353 | 2,205 | 1,545 | 1,606 | 1,217 | 1,354 |
| 2000 | 1,104 | 916 | 997 | 1,138 | 982 | 1,212 | 1,300 | 908 | 1,430 | 1,381 | 1,421 | 1,522 |
| 2001 | 1,082 | 1,089 | 734 | 1,018 | 904 | 753 | 829 | 990 | 1,160 | 915 | 1,305 | 1,890 |
| 2002 | 1,612 | 1,513 | 1,729 | 1,549 | 1,514 | 1,522 | 1,015 | 954 | 1,025 | 1,400 | 1,103 | 1,585 |
| 2003 | 1,363 | 803 | 713 | 489 | 931 | 1,142 | 1,239 | 1,085 | 845 | 1,001 | 1,321 | 883 |
| 2004 | 1,301 | 990 | 1,082 | 964 | 1,123 | 840 | 1,131 | 954 | 682 | 949 | 924 | 1,250 |
| 2005 | 907 | 1,069 | 1,122 | 769 | 1,111 | 972 | 1,113 | 983 | 1,052 | 754 | 746 | 778 |
| 2006 | 1,126 | 1,775 | 929 | 901 | 1,405 | 861 | 1,697 | 2,211 | 1,972 | 1,727 | 1,276 | 1,024 |
| 2007 | 1,214 | 1,188 | 1,495 | 1,303 | 1,187 | 926 | 1,053 | 707 | 1,059 | 1,182 | 1,264 | 1,335 |
| 2008 | 1,205 | 979 | 1,379 | 1,213 | 1,048 | 898 | 1,254 | 926 | 1,142 | 1,095 | 1,267 | 1,364 |
| 2009 | 1,125 | 1,182 | 1,208 | 1,326 | 1,142 | 1,356 | 1,371 | 1,416 | 1,372 | 1,828 | 1,080 | 1,362 |
| 2010 | 1,190 | 1,288 | 1,057 | 1,116 | 1,289 | 1,277 | 1,501 | 1,261 | 1,188 | 1,208 | 1,524 | 1,724 |
| 2011 | 1,443 | 1,547 | 1,541 | 1,329 | 1,370 | 1,457 | 1,254 | 1,857 | 1,890 | 1,741 | 1,515 | 1,510 |
| 2012 | 1,348 | 1,090 | 1,168 | 962 | 1,236 | 1,591 | 1,624 | 1,443 | 1,180 | 1,461 | 1,684 | 2,000 |
| 2013 | 1,223 | 808 | 1,094 | 1,119 | 1,537 | 1,268 | 1,453 | 1,405 | 1,679 | 1,162 | 1,464 | 1,028 |
| 2014 | 1,449 | 1,510 | 1,730 | 1,818 | 1,610 | 1,435 | 1,561 | 1,429 | 1,601 | 1,348 | 1,672 | 1,440 |
| 2015 | 1,555 | 1,729 | 1,620 | 1,878 | 1,790 | 1,581 | 1,904 | 1,793 | 1,752 | 1,402 | 1,267 | 1,431 |
| 2016 | 1,305 | 1,313 | 1,341 | 1,604 | 1,367 | 1,335 | 1,644 | 1,711 | 1,345 | 1,219 | 1,585 | 1,657 |
| 2017 | 1,542 | 1,836 | 1,215 | 1,495 | 1,633 | 1,707 | 2,147 | 1,554 | 1,164 | 1,527 | 1,219 | 1,855 |
| 2018 | 1,817 | 1,627 | 1,392 | 1,621 | 1,045 | 1,579 | 1,669 | 1,324 | 1,347 | 1,445 | 1,395 | 1,490 |
| 2019 | 1,111 | 1,687 | 1,485 | 1,523 | 1,187 | 1,330 | 1,708 | 1,664 | 1,285 | 1,382 | 1,340 | 1,936 |
| 2020 | 1,562 | 1,561 | 1,460 | 1,508 | 1,919 | 1,914 | 2,761 | 2,661 | 2,120 | 1,303 | 1,413 | 1,601 |
| 2021 | 1,682 | 1,312 | 1,674 | 1,465 | 1,405 | 1,550 | 1,682 | 1,405 | 1,237 | 1,443 | 1,612 | 1,017 |
| 2022 | 1,134 | 1,107 | 1,459 | 1,336 | 1,555 | 1,499 | 1,513 | 1,449 | 1,282 | 1,234 | 1,503 | 1,181 |
| 2023 | 1,210 | 1,123 | 1,218 | 1,399 | 1,462 | 1,214 | 1,126 | 1,135 | 1,312 | 1,301 | 1,188 | 1,583 |
| 2024 | 1,645 | 1,130 | ||||||||||
| - = No Data Reported; -- = Not Applicable; NA = Not Available; W = Withheld to avoid disclosure of individual company data. |
| Release Date: 4/30/2024 |
| Next Release Date: 5/31/2024 |