|
Download Data (XLS File) |
|
||||||||
|
||||||||
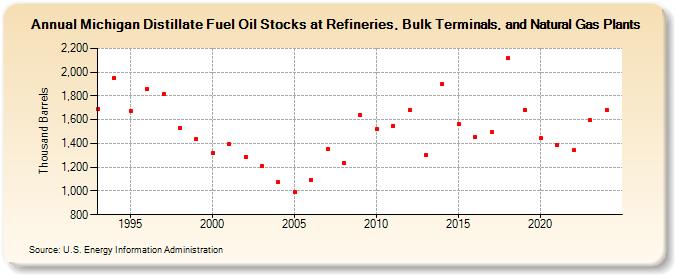
| Michigan Distillate Fuel Oil Stocks at Refineries, Bulk Terminals, and Natural Gas Plants (Thousand Barrels) | ||||||||
| Decade | Year-0 | Year-1 | Year-2 | Year-3 | Year-4 | Year-5 | Year-6 | Year-7 | Year-8 | Year-9 |
|---|---|---|---|---|---|---|---|---|---|---|
| 1990's | 1,688 | 1,949 | 1,677 | 1,857 | 1,813 | 1,532 | 1,439 | |||
| 2000's | 1,316 | 1,392 | 1,288 | 1,208 | 1,074 | 989 | 1,093 | 1,352 | 1,239 | 1,639 |
| 2010's | 1,520 | 1,550 | 1,680 | 1,304 | 1,901 | 1,564 | 1,450 | 1,493 | 2,115 | 1,685 |
| 2020's | 1,443 | 1,386 | 1,342 | 1,594 |
| - = No Data Reported; -- = Not Applicable; NA = Not Available; W = Withheld to avoid disclosure of individual company data. |
| Release Date: 3/29/2024 |
| Next Release Date: 8/30/2024 |