|
Download Data (XLS File) |
|
||||||||
|
||||||||
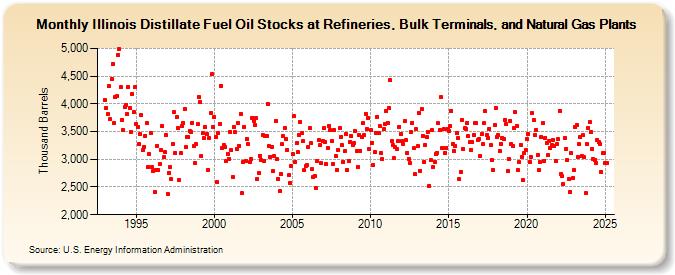
| Illinois Distillate Fuel Oil Stocks at Refineries, Bulk Terminals, and Natural Gas Plants (Thousand Barrels) | ||||||||
| Year | Jan | Feb | Mar | Apr | May | Jun | Jul | Aug | Sep | Oct | Nov | Dec |
|---|---|---|---|---|---|---|---|---|---|---|---|---|
| 1993 | 4,072 | 3,933 | 3,812 | 4,313 | 3,719 | 4,447 | 4,726 | 3,657 | 4,115 | 4,135 | 4,882 | 4,987 |
| 1994 | 4,303 | 3,713 | 3,520 | 3,938 | 3,977 | 3,820 | 4,303 | 3,925 | 3,488 | 4,186 | 3,855 | 4,305 |
| 1995 | 3,635 | 3,584 | 3,270 | 3,449 | 3,793 | 3,159 | 3,224 | 3,426 | 3,657 | 2,862 | 3,088 | 3,475 |
| 1996 | 2,865 | 2,797 | 2,411 | 2,814 | 3,237 | 2,810 | 2,918 | 3,170 | 3,599 | 3,036 | 3,128 | 3,444 |
| 1997 | 2,375 | 2,759 | 2,863 | 2,636 | 3,278 | 3,852 | 3,110 | 3,757 | 3,563 | 2,621 | 3,107 | 3,602 |
| 1998 | 3,662 | 3,903 | 3,221 | 3,393 | 3,403 | 3,511 | 3,496 | 3,660 | 3,236 | 2,937 | 3,270 | 3,628 |
| 1999 | 4,127 | 4,027 | 3,057 | 3,466 | 3,376 | 3,590 | 3,450 | 2,807 | 3,383 | 3,833 | 4,532 | 3,589 |
| 2000 | 3,756 | 3,405 | 2,585 | 3,474 | 3,643 | 4,328 | 3,206 | 3,252 | 3,222 | 2,975 | 3,100 | 3,010 |
| 2001 | 3,496 | 3,167 | 2,682 | 3,584 | 3,483 | 3,186 | 3,652 | 3,247 | 3,819 | 2,384 | 2,956 | 3,585 |
| 2002 | 2,970 | 3,371 | 3,269 | 2,944 | 2,997 | 3,751 | 3,694 | 3,619 | 3,744 | 2,645 | 2,748 | 3,067 |
| 2003 | 2,988 | 3,431 | 2,970 | 3,419 | 3,423 | 3,998 | 3,237 | 3,050 | 3,227 | 2,781 | 3,052 | 3,697 |
| 2004 | 2,996 | 2,648 | 2,423 | 2,738 | 3,270 | 3,414 | 3,567 | 3,358 | 3,175 | 2,712 | 2,569 | 2,887 |
| 2005 | 3,095 | 3,774 | 2,954 | 3,286 | 3,123 | 3,441 | 3,668 | 3,467 | 3,323 | 2,799 | 2,874 | 2,892 |
| 2006 | 3,230 | 3,563 | 3,285 | 2,818 | 2,673 | 2,707 | 2,483 | 2,977 | 3,344 | 3,258 | 2,924 | 3,323 |
| 2007 | 3,565 | 3,306 | 2,911 | 3,204 | 3,605 | 3,525 | 3,327 | 2,923 | 3,524 | 3,054 | 2,810 | 3,171 |
| 2008 | 3,559 | 3,402 | 3,250 | 2,956 | 3,146 | 3,448 | 2,815 | 2,970 | 3,319 | 3,418 | 3,254 | 3,288 |
| 2009 | 3,507 | 3,153 | 2,869 | 3,441 | 3,157 | 3,408 | 3,648 | 3,435 | 3,825 | 3,550 | 3,753 | 3,185 |
| 2010 | 3,519 | 3,300 | 2,900 | 3,128 | 3,477 | 3,766 | 3,473 | 3,598 | 3,113 | 2,998 | 3,543 | 3,645 |
| 2011 | 3,869 | 3,663 | 3,916 | 4,423 | 3,329 | 3,251 | 3,015 | 3,216 | 3,185 | 3,321 | 3,591 | 3,453 |
| 2012 | 3,329 | 3,271 | 3,689 | 3,342 | 3,122 | 3,012 | 2,941 | 3,491 | 3,661 | 3,198 | 2,726 | 3,538 |
| 2013 | 3,233 | 3,841 | 2,795 | 3,904 | 3,427 | 2,957 | 3,257 | 3,394 | 3,500 | 2,519 | 2,981 | 3,525 |
| 2014 | 2,852 | 2,959 | 3,091 | 3,119 | 3,647 | 3,525 | 4,116 | 3,209 | 3,543 | 3,115 | 3,211 | 3,554 |
| 2015 | 3,511 | 3,598 | 3,869 | 3,280 | 3,146 | 3,241 | 3,475 | 3,380 | 2,637 | 2,773 | 3,715 | 3,186 |
| 2016 | 3,557 | 3,547 | 3,650 | 3,415 | 3,303 | 3,171 | 3,309 | 3,440 | 3,648 | 3,653 | 3,347 | 3,357 |
| 2017 | 3,060 | 3,455 | 3,270 | 3,647 | 3,863 | 3,438 | 3,386 | 3,550 | 3,261 | 2,991 | 2,813 | 3,616 |
| 2018 | 3,923 | 3,407 | 3,431 | 3,142 | 3,277 | 3,384 | 3,372 | 3,716 | 3,633 | 2,788 | 3,003 | 3,698 |
| 2019 | 3,276 | 3,237 | 3,568 | 3,844 | 3,607 | 2,809 | 2,946 | 3,262 | 3,047 | 2,625 | 3,116 | 3,162 |
| 2020 | 3,363 | 3,459 | 2,959 | 3,040 | 3,839 | 3,715 | 3,440 | 3,533 | 3,073 | 2,804 | 2,944 | 3,398 |
| 2021 | 3,655 | 2,969 | 3,390 | 3,301 | 3,072 | 3,333 | 3,209 | 3,262 | 3,347 | 3,241 | 2,965 | 3,268 |
| 2022 | 3,360 | 3,877 | 2,738 | 2,690 | 2,553 | 3,385 | 3,187 | 2,989 | 2,644 | 2,415 | 3,107 | 2,659 |
| 2023 | 2,805 | 3,580 | 3,610 | 3,038 | 3,266 | 3,397 | 3,054 | 3,431 | 3,035 | 2,390 | 3,278 | 3,561 |
| 2024 | 3,672 | |||||||||||
| - = No Data Reported; -- = Not Applicable; NA = Not Available; W = Withheld to avoid disclosure of individual company data. |
| Release Date: 3/29/2024 |
| Next Release Date: 4/30/2024 |