|
Download Data (XLS File) |
|
||||||||
|
||||||||
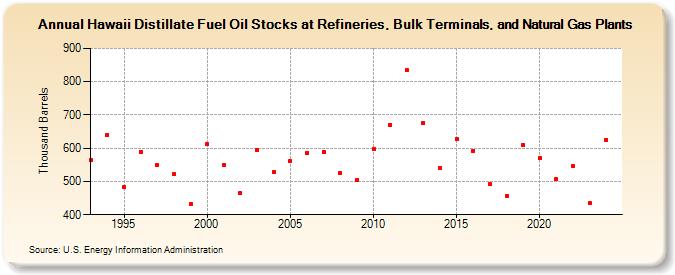
| Hawaii Distillate Fuel Oil Stocks at Refineries, Bulk Terminals, and Natural Gas Plants (Thousand Barrels) | ||||||||
| Decade | Year-0 | Year-1 | Year-2 | Year-3 | Year-4 | Year-5 | Year-6 | Year-7 | Year-8 | Year-9 |
|---|---|---|---|---|---|---|---|---|---|---|
| 1990's | 564 | 641 | 482 | 590 | 549 | 522 | 431 | |||
| 2000's | 612 | 550 | 465 | 594 | 528 | 561 | 586 | 589 | 526 | 504 |
| 2010's | 599 | 671 | 834 | 675 | 541 | 628 | 593 | 492 | 457 | 611 |
| 2020's | 570 | 506 | 545 | 439 |
| - = No Data Reported; -- = Not Applicable; NA = Not Available; W = Withheld to avoid disclosure of individual company data. |
| Release Date: 3/29/2024 |
| Next Release Date: 8/30/2024 |