|
Download Data (XLS File) |
|
||||||||
|
||||||||
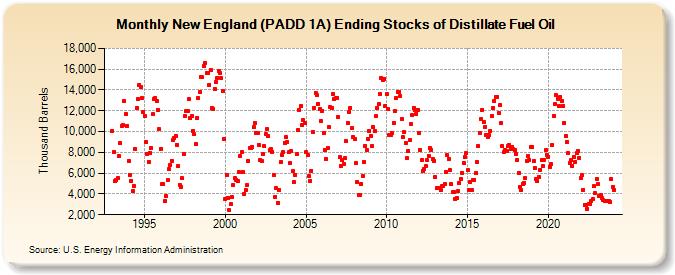
| New England (PADD 1A) Ending Stocks of Distillate Fuel Oil (Thousand Barrels) | ||||||||
| Year | Jan | Feb | Mar | Apr | May | Jun | Jul | Aug | Sep | Oct | Nov | Dec |
|---|---|---|---|---|---|---|---|---|---|---|---|---|
| 1993 | 10,094 | 8,051 | 5,200 | 5,349 | 5,531 | 7,629 | 8,858 | 10,574 | 10,610 | 12,936 | 11,734 | 10,575 |
| 1994 | 7,179 | 5,847 | 5,284 | 4,280 | 4,768 | 8,311 | 12,304 | 13,130 | 14,502 | 14,291 | 13,226 | 11,893 |
| 1995 | 11,528 | 8,975 | 7,840 | 7,098 | 7,983 | 8,439 | 11,651 | 13,141 | 13,207 | 12,930 | 12,109 | 10,218 |
| 1996 | 8,357 | 4,957 | 4,913 | 3,324 | 3,758 | 5,340 | 6,366 | 6,753 | 7,210 | 9,160 | 9,401 | 9,604 |
| 1997 | 8,741 | 6,680 | 4,883 | 4,678 | 5,499 | 7,827 | 11,484 | 11,966 | 11,929 | 13,117 | 11,264 | 11,505 |
| 1998 | 10,076 | 9,721 | 8,795 | 11,287 | 13,212 | 13,795 | 15,247 | 15,200 | 16,322 | 16,631 | 15,650 | 15,627 |
| 1999 | 14,509 | 15,933 | 12,251 | 12,188 | 14,098 | 14,764 | 15,177 | 15,794 | 15,615 | 15,109 | 13,855 | 9,276 |
| 2000 | 3,540 | 5,826 | 3,609 | 2,407 | 3,002 | 3,685 | 4,862 | 5,490 | 5,384 | 5,233 | 6,094 | 7,624 |
| 2001 | 8,022 | 6,147 | 4,038 | 4,338 | 4,831 | 7,174 | 8,400 | 8,393 | 8,551 | 10,390 | 10,816 | 9,819 |
| 2002 | 9,902 | 8,754 | 7,255 | 7,157 | 7,794 | 8,565 | 9,785 | 10,211 | 9,585 | 8,206 | 8,292 | 8,068 |
| 2003 | 5,775 | 3,737 | 4,526 | 3,175 | 4,408 | 7,053 | 7,775 | 7,991 | 8,944 | 9,449 | 9,010 | 8,002 |
| 2004 | 6,974 | 8,136 | 6,180 | 5,157 | 5,855 | 7,818 | 10,164 | 12,118 | 12,424 | 10,648 | 11,103 | 10,832 |
| 2005 | 8,039 | 7,752 | 5,724 | 5,290 | 6,248 | 9,964 | 12,278 | 13,740 | 13,483 | 12,672 | 12,210 | 11,043 |
| 2006 | 12,024 | 9,830 | 8,251 | 7,372 | 8,406 | 10,429 | 12,373 | 12,309 | 13,617 | 13,162 | 13,213 | 13,240 |
| 2007 | 11,407 | 7,505 | 6,725 | 7,220 | 6,924 | 7,430 | 9,085 | 10,843 | 11,847 | 12,269 | 10,315 | 9,468 |
| 2008 | 9,317 | 6,932 | 5,147 | 3,925 | 3,937 | 4,959 | 5,730 | 7,072 | 8,615 | 8,249 | 9,318 | 10,098 |
| 2009 | 9,588 | 8,607 | 10,419 | 10,100 | 11,468 | 12,292 | 12,658 | 13,648 | 15,169 | 15,006 | 15,074 | 12,495 |
| 2010 | 13,598 | 12,127 | 9,677 | 9,702 | 9,813 | 10,865 | 11,998 | 13,226 | 13,852 | 13,852 | 13,440 | 11,231 |
| 2011 | 9,453 | 9,917 | 8,920 | 7,472 | 8,144 | 9,172 | 10,688 | 11,554 | 12,293 | 12,086 | 11,719 | 12,089 |
| 2012 | 9,885 | 8,211 | 7,251 | 6,228 | 6,372 | 6,660 | 7,250 | 7,683 | 8,403 | 8,243 | 7,373 | 7,192 |
| 2013 | 5,614 | 4,546 | 4,549 | 4,563 | 4,347 | 4,721 | 4,734 | 4,959 | 6,116 | 7,702 | 7,403 | 6,280 |
| 2014 | 4,919 | 4,149 | 4,162 | 3,482 | 3,625 | 4,238 | 5,039 | 5,456 | 6,036 | 6,977 | 7,539 | 7,930 |
| 2015 | 6,270 | 4,421 | 5,151 | 4,371 | 5,319 | 5,372 | 6,003 | 7,047 | 8,587 | 9,815 | 11,245 | 12,109 |
| 2016 | 10,949 | 10,449 | 9,714 | 9,494 | 9,643 | 10,064 | 11,538 | 12,300 | 12,969 | 13,360 | 13,350 | 11,828 |
| 2017 | 12,516 | 10,843 | 8,593 | 8,032 | 8,219 | 8,174 | 8,582 | 8,721 | 8,286 | 8,527 | 8,276 | 8,233 |
| 2018 | 7,857 | 7,281 | 6,021 | 4,687 | 4,385 | 4,993 | 5,097 | 5,516 | 7,187 | 7,603 | 7,272 | 8,535 |
| 2019 | 8,532 | 7,167 | 6,481 | 5,446 | 5,242 | 5,629 | 6,316 | 7,276 | 6,680 | 7,286 | 8,229 | 7,771 |
| 2020 | 7,574 | 6,600 | 6,852 | 8,725 | 11,498 | 12,649 | 13,480 | 13,173 | 12,434 | 13,365 | 12,941 | 12,484 |
| 2021 | 10,863 | 9,575 | 9,013 | 7,932 | 7,011 | 7,226 | 6,700 | 7,563 | 7,089 | 7,925 | 8,144 | 7,469 |
| 2022 | 5,489 | 5,780 | 4,419 | 2,953 | 2,902 | 2,577 | 3,064 | 3,044 | 3,329 | 3,482 | 4,728 | 4,052 |
| 2023 | 5,451 | 4,980 | 3,812 | 3,889 | 3,595 | 3,377 | 3,361 | 3,285 | 3,300 | 3,304 | 3,237 | 5,440 |
| 2024 | 4,705 | |||||||||||
| - = No Data Reported; -- = Not Applicable; NA = Not Available; W = Withheld to avoid disclosure of individual company data. |
| Release Date: 3/29/2024 |
| Next Release Date: 4/30/2024 |