|
Download Data (XLS File) |
|
||||||||
|
||||||||
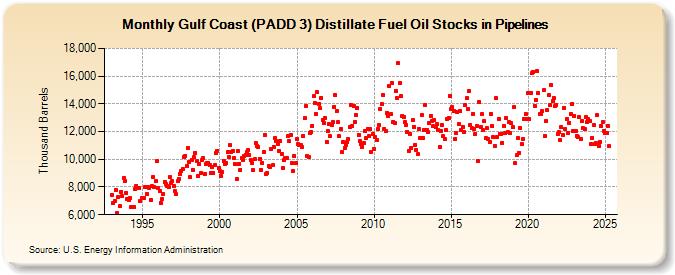
| Gulf Coast (PADD 3) Distillate Fuel Oil Stocks in Pipelines (Thousand Barrels) | ||||||||
| Year | Jan | Feb | Mar | Apr | May | Jun | Jul | Aug | Sep | Oct | Nov | Dec |
|---|---|---|---|---|---|---|---|---|---|---|---|---|
| 1993 | 7,458 | 6,846 | 7,007 | 7,794 | 6,128 | 7,314 | 6,594 | 7,670 | 7,318 | 8,634 | 8,441 | 7,569 |
| 1994 | 7,131 | 7,093 | 7,195 | 6,539 | 6,568 | 6,587 | 7,861 | 8,095 | 7,948 | 7,959 | 6,966 | 7,185 |
| 1995 | 7,210 | 7,196 | 7,974 | 7,495 | 7,990 | 7,962 | 7,073 | 8,050 | 8,732 | 7,969 | 8,408 | 9,852 |
| 1996 | 7,929 | 7,738 | 6,872 | 7,136 | 7,500 | 8,383 | 8,236 | 8,095 | 8,017 | 8,714 | 8,263 | 8,403 |
| 1997 | 8,101 | 7,676 | 7,466 | 8,400 | 8,594 | 8,930 | 9,132 | 9,328 | 10,133 | 10,258 | 9,508 | 10,780 |
| 1998 | 9,839 | 8,691 | 9,955 | 9,254 | 10,130 | 10,488 | 9,876 | 8,800 | 9,657 | 8,988 | 9,926 | 10,074 |
| 1999 | 8,936 | 9,647 | 9,703 | 9,713 | 9,588 | 9,002 | 9,465 | 9,034 | 9,584 | 10,436 | 10,627 | 9,385 |
| 2000 | 9,175 | 8,811 | 9,099 | 9,852 | 9,676 | 9,747 | 10,505 | 10,178 | 11,021 | 10,545 | 10,568 | 10,090 |
| 2001 | 9,630 | 8,608 | 10,598 | 9,682 | 9,253 | 10,089 | 9,983 | 10,207 | 10,332 | 10,522 | 10,651 | 10,318 |
| 2002 | 9,913 | 9,700 | 9,201 | 10,001 | 11,140 | 10,971 | 10,878 | 10,055 | 9,256 | 9,740 | 10,525 | 11,756 |
| 2003 | 8,952 | 9,002 | 9,532 | 9,448 | 10,737 | 9,566 | 10,871 | 11,522 | 11,301 | 11,122 | 10,628 | 11,333 |
| 2004 | 10,393 | 9,356 | 9,916 | 10,117 | 10,105 | 11,646 | 11,329 | 11,774 | 9,714 | 9,162 | 10,227 | 9,697 |
| 2005 | 11,450 | 11,097 | 11,053 | 10,995 | 10,850 | 11,681 | 12,970 | 13,841 | 10,234 | 10,184 | 11,903 | 11,985 |
| 2006 | 12,434 | 14,533 | 14,068 | 13,295 | 14,824 | 14,011 | 13,667 | 14,439 | 12,826 | 12,591 | 12,980 | 11,271 |
| 2007 | 12,018 | 12,530 | 11,648 | 12,488 | 12,693 | 13,797 | 14,629 | 13,455 | 12,663 | 11,655 | 12,210 | 10,530 |
| 2008 | 11,227 | 10,824 | 11,021 | 11,231 | 11,445 | 12,294 | 13,887 | 12,416 | 13,822 | 12,690 | 13,202 | 13,726 |
| 2009 | 11,728 | 11,288 | 11,088 | 10,918 | 11,167 | 12,042 | 11,563 | 12,185 | 11,647 | 12,157 | 10,545 | 11,830 |
| 2010 | 10,725 | 11,594 | 11,359 | 12,166 | 12,475 | 13,640 | 13,959 | 14,642 | 12,168 | 12,023 | 13,358 | 13,153 |
| 2011 | 15,299 | 13,254 | 15,520 | 12,704 | 12,637 | 14,937 | 14,423 | 16,925 | 15,487 | 14,554 | 13,142 | 13,051 |
| 2012 | 12,658 | 12,477 | 11,986 | 10,626 | 11,847 | 10,832 | 12,818 | 12,347 | 11,033 | 10,678 | 10,361 | 12,203 |
| 2013 | 11,531 | 13,195 | 11,541 | 12,142 | 13,942 | 12,139 | 11,964 | 12,631 | 13,140 | 12,774 | 12,378 | 12,849 |
| 2014 | 12,317 | 12,523 | 12,088 | 10,883 | 12,072 | 12,447 | 11,689 | 11,462 | 12,094 | 12,901 | 12,990 | 14,587 |
| 2015 | 13,601 | 13,768 | 13,483 | 11,483 | 11,918 | 13,398 | 12,524 | 13,447 | 12,141 | 12,357 | 11,990 | 13,906 |
| 2016 | 14,386 | 13,623 | 14,939 | 12,500 | 12,267 | 13,273 | 12,189 | 11,832 | 12,414 | 9,842 | 14,122 | 12,344 |
| 2017 | 13,241 | 12,088 | 12,756 | 11,533 | 12,230 | 11,449 | 11,267 | 13,278 | 12,385 | 11,588 | 10,966 | 14,386 |
| 2018 | 11,607 | 12,933 | 11,846 | 11,838 | 11,204 | 12,422 | 11,864 | 12,974 | 11,964 | 12,701 | 11,879 | 12,592 |
| 2019 | 12,298 | 13,767 | 9,708 | 10,283 | 11,531 | 10,483 | 12,272 | 11,113 | 11,464 | 12,938 | 13,265 | 12,875 |
| 2020 | 14,765 | 12,903 | 14,808 | 16,228 | 16,275 | 13,844 | 14,303 | 16,341 | 14,764 | 13,266 | 13,242 | 13,480 |
| 2021 | 14,970 | 11,681 | 12,769 | 13,545 | 14,633 | 13,941 | 15,341 | 14,204 | 14,433 | 13,838 | 13,915 | 11,827 |
| 2022 | 11,940 | 11,375 | 12,295 | 11,774 | 13,688 | 12,158 | 12,901 | 11,898 | 12,636 | 13,272 | 14,005 | 12,037 |
| 2023 | 13,075 | 11,977 | 11,670 | 11,560 | 12,969 | 11,502 | 12,749 | 12,307 | 12,270 | 13,288 | 12,839 | 13,114 |
| 2024 | 12,762 | |||||||||||
| - = No Data Reported; -- = Not Applicable; NA = Not Available; W = Withheld to avoid disclosure of individual company data. |
| Release Date: 3/29/2024 |
| Next Release Date: 4/30/2024 |