|
Download Data (XLS File) |
|
||||||||
|
||||||||
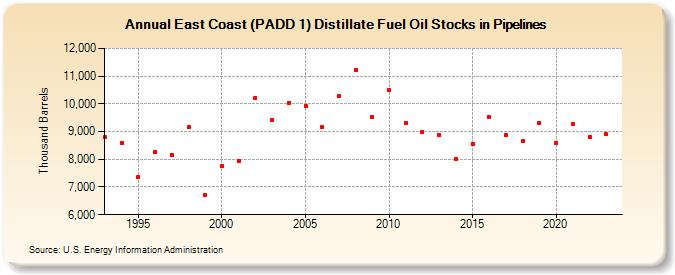
| East Coast (PADD 1) Distillate Fuel Oil Stocks in Pipelines (Thousand Barrels) | ||||||||
| Decade | Year-0 | Year-1 | Year-2 | Year-3 | Year-4 | Year-5 | Year-6 | Year-7 | Year-8 | Year-9 |
|---|---|---|---|---|---|---|---|---|---|---|
| 1990's | 8,793 | 8,594 | 7,374 | 8,270 | 8,152 | 9,160 | 6,702 | |||
| 2000's | 7,748 | 7,937 | 10,226 | 9,423 | 10,044 | 9,933 | 9,150 | 10,296 | 11,218 | 9,521 |
| 2010's | 10,506 | 9,315 | 8,982 | 8,870 | 8,011 | 8,566 | 9,519 | 8,866 | 8,661 | 9,323 |
| 2020's | 8,599 | 9,262 | 8,819 | 8,902 |
| - = No Data Reported; -- = Not Applicable; NA = Not Available; W = Withheld to avoid disclosure of individual company data. |
| Release Date: 8/30/2024 |
| Next Release Date: 8/29/2025 |