|
Download Data (XLS File) |
|
||||||||
|
||||||||
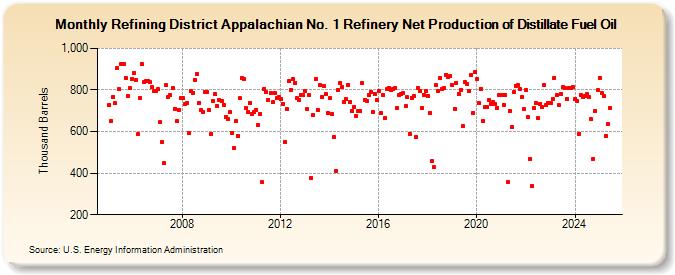
| Refining District Appalachian No. 1 Refinery Net Production of Distillate Fuel Oil (Thousand Barrels) | ||||||||
| Year | Jan | Feb | Mar | Apr | May | Jun | Jul | Aug | Sep | Oct | Nov | Dec |
|---|---|---|---|---|---|---|---|---|---|---|---|---|
| 2005 | 730 | 651 | 768 | 735 | 907 | 803 | 927 | 925 | 859 | 773 | 810 | 855 |
| 2006 | 884 | 849 | 586 | 762 | 926 | 839 | 843 | 845 | 836 | 812 | 795 | 796 |
| 2007 | 803 | 644 | 550 | 447 | 822 | 768 | 774 | 811 | 709 | 649 | 706 | 760 |
| 2008 | 760 | 731 | 737 | 591 | 794 | 787 | 848 | 877 | 739 | 702 | 692 | 792 |
| 2009 | 791 | 702 | 588 | 747 | 779 | 724 | 751 | 748 | 730 | 670 | 659 | 693 |
| 2010 | 594 | 522 | 649 | 580 | 759 | 858 | 853 | 714 | 694 | 739 | 686 | 695 |
| 2011 | 706 | 632 | 685 | 355 | 807 | 789 | 754 | 786 | 742 | 787 | 762 | 764 |
| 2012 | 756 | 733 | 552 | 707 | 843 | 802 | 852 | 835 | 759 | 753 | 777 | 775 |
| 2013 | 793 | 707 | 776 | 377 | 681 | 852 | 706 | 822 | 766 | 821 | 781 | 690 |
| 2014 | 760 | 685 | 573 | 411 | 800 | 834 | 814 | 743 | 757 | 826 | 742 | 697 |
| 2015 | 717 | 675 | 699 | 697 | 834 | 754 | 749 | 776 | 792 | 696 | 783 | 751 |
| 2016 | 796 | 689 | 775 | 664 | 803 | 810 | 801 | 805 | 810 | 714 | 775 | 779 |
| 2017 | 785 | 721 | 764 | 590 | 762 | 769 | 573 | 810 | 796 | 714 | 778 | 796 |
| 2018 | 770 | 691 | 458 | 428 | 823 | 793 | 858 | 805 | 808 | 873 | 862 | 867 |
| 2019 | 822 | 710 | 834 | 782 | 800 | 625 | 838 | 831 | 794 | 874 | 689 | 888 |
| 2020 | 851 | 738 | 807 | 649 | 720 | 717 | 753 | 733 | 740 | 732 | 715 | 775 |
| 2021 | 776 | 730 | 776 | 356 | 700 | 621 | 790 | 821 | 822 | 805 | 766 | 707 |
| 2022 | 800 | 669 | 469 | 339 | 713 | 738 | 665 | 734 | 718 | 825 | 729 | 738 |
| 2023 | 735 | 758 | 858 | 777 | 726 | 782 | 813 | 811 | 758 | 809 | 809 | 815 |
| 2024 | 758 | 745 | 590 | 774 | ||||||||
| - = No Data Reported; -- = Not Applicable; NA = Not Available; W = Withheld to avoid disclosure of individual company data. |
| Release Date: 6/28/2024 |
| Next Release Date: 7/31/2024 |