|
Download Data (XLS File) |
|
||||||||
|
||||||||
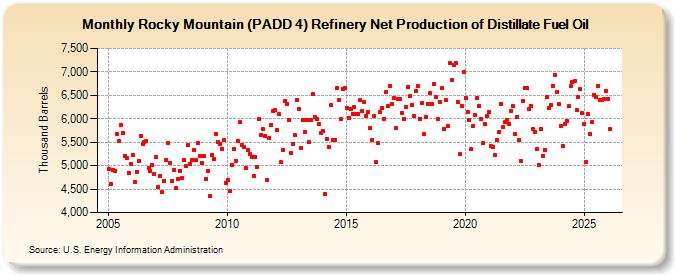
| Rocky Mountain (PADD 4) Refinery Net Production of Distillate Fuel Oil (Thousand Barrels) | ||||||||
| Year | Jan | Feb | Mar | Apr | May | Jun | Jul | Aug | Sep | Oct | Nov | Dec |
|---|---|---|---|---|---|---|---|---|---|---|---|---|
| 2005 | 4,935 | 4,616 | 4,910 | 4,892 | 5,677 | 5,519 | 5,859 | 5,706 | 5,207 | 5,161 | 4,849 | 5,043 |
| 2006 | 5,229 | 4,644 | 4,874 | 5,099 | 5,624 | 5,467 | 5,503 | 5,526 | 4,945 | 4,885 | 5,012 | 4,827 |
| 2007 | 5,175 | 4,553 | 4,788 | 4,432 | 4,671 | 5,129 | 5,473 | 5,058 | 4,671 | 4,918 | 4,528 | 4,720 |
| 2008 | 4,896 | 4,736 | 5,112 | 4,995 | 5,449 | 5,043 | 5,116 | 5,342 | 5,117 | 5,487 | 5,201 | 5,052 |
| 2009 | 5,214 | 4,715 | 4,878 | 4,352 | 5,236 | 5,148 | 5,677 | 5,508 | 5,452 | 5,365 | 5,537 | 4,636 |
| 2010 | 4,684 | 4,451 | 5,017 | 5,347 | 5,107 | 5,533 | 5,928 | 5,444 | 5,391 | 4,960 | 5,325 | 5,246 |
| 2011 | 5,194 | 4,790 | 5,180 | 4,972 | 6,000 | 5,658 | 5,773 | 5,634 | 4,686 | 5,598 | 5,867 | 6,169 |
| 2012 | 6,183 | 5,769 | 6,098 | 5,072 | 5,343 | 6,378 | 6,320 | 5,978 | 5,264 | 5,471 | 5,643 | 6,394 |
| 2013 | 6,216 | 5,371 | 5,974 | 5,724 | 5,969 | 5,497 | 5,980 | 6,517 | 6,033 | 5,986 | 5,881 | 5,686 |
| 2014 | 5,737 | 4,400 | 5,564 | 5,398 | 6,287 | 5,543 | 5,552 | 6,662 | 6,394 | 5,991 | 6,641 | 6,660 |
| 2015 | 6,239 | 6,022 | 6,205 | 6,105 | 6,253 | 6,103 | 6,107 | 6,393 | 6,157 | 6,361 | 6,063 | 6,136 |
| 2016 | 5,795 | 5,548 | 6,057 | 5,075 | 5,480 | 6,134 | 6,231 | 6,005 | 6,568 | 6,262 | 6,704 | 6,305 |
| 2017 | 6,438 | 5,801 | 6,411 | 6,421 | 6,132 | 5,988 | 6,257 | 6,679 | 6,488 | 6,288 | 6,065 | 6,587 |
| 2018 | 6,706 | 5,996 | 6,341 | 5,669 | 6,038 | 6,317 | 6,554 | 6,310 | 6,740 | 6,469 | 5,994 | 6,359 |
| 2019 | 6,648 | 5,790 | 6,401 | 5,837 | 7,178 | 6,834 | 7,153 | 7,181 | 6,365 | 5,238 | 6,264 | 7,000 |
| 2020 | 6,449 | 6,140 | 5,971 | 5,350 | 5,851 | 6,084 | 6,438 | 6,276 | 5,995 | 5,478 | 5,880 | 6,061 |
| 2021 | 6,145 | 5,426 | 5,390 | 5,227 | 5,538 | 5,728 | 6,322 | 5,832 | 5,923 | 5,983 | 5,896 | 6,170 |
| 2022 | 6,262 | 5,680 | 6,033 | 5,539 | 5,107 | 6,371 | 6,656 | 6,652 | 6,204 | 6,279 | 5,777 | 5,709 |
| 2023 | 5,354 | 5,132 | 5,788 | 5,210 | 5,335 | 6,467 | 6,230 | 6,288 | 6,692 | 6,939 | 6,562 | 6,309 |
| 2024 | 5,855 | |||||||||||
| - = No Data Reported; -- = Not Applicable; NA = Not Available; W = Withheld to avoid disclosure of individual company data. |
| Release Date: 3/29/2024 |
| Next Release Date: 4/30/2024 |