|
Download Data (XLS File) |
|
||||||||
|
||||||||
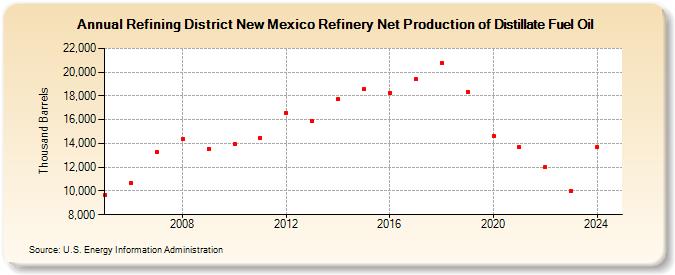
| Refining District New Mexico Refinery Net Production of Distillate Fuel Oil (Thousand Barrels) | ||||||||
| Decade | Year-0 | Year-1 | Year-2 | Year-3 | Year-4 | Year-5 | Year-6 | Year-7 | Year-8 | Year-9 |
|---|---|---|---|---|---|---|---|---|---|---|
| 2000's | 9,632 | 10,691 | 13,296 | 14,401 | 13,572 | |||||
| 2010's | 13,932 | 14,466 | 16,565 | 15,852 | 17,699 | 18,575 | 18,273 | 19,399 | 20,787 | 18,334 |
| 2020's | 14,635 | 13,677 | 11,988 | 10,024 |
| - = No Data Reported; -- = Not Applicable; NA = Not Available; W = Withheld to avoid disclosure of individual company data. |
| Release Date: 3/29/2024 |
| Next Release Date: 8/30/2024 |