|
Download Data (XLS File) |
|
||||||||
|
||||||||
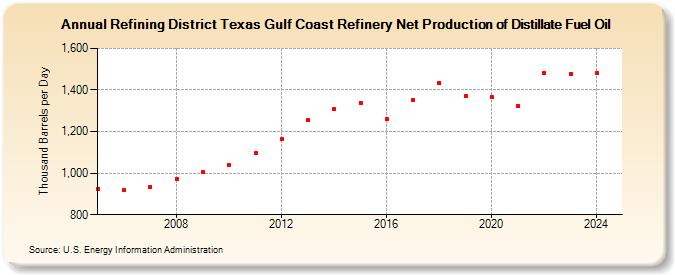
| Refining District Texas Gulf Coast Refinery Net Production of Distillate Fuel Oil (Thousand Barrels per Day) | ||||||||
| Decade | Year-0 | Year-1 | Year-2 | Year-3 | Year-4 | Year-5 | Year-6 | Year-7 | Year-8 | Year-9 |
|---|---|---|---|---|---|---|---|---|---|---|
| 2000's | 924 | 920 | 935 | 972 | 1,004 | |||||
| 2010's | 1,038 | 1,098 | 1,162 | 1,255 | 1,307 | 1,338 | 1,260 | 1,350 | 1,434 | 1,373 |
| 2020's | 1,364 | 1,325 | 1,483 | 1,485 |
| - = No Data Reported; -- = Not Applicable; NA = Not Available; W = Withheld to avoid disclosure of individual company data. |
| Release Date: 3/29/2024 |
| Next Release Date: 8/30/2024 |