|
Download Data (XLS File) |
|
||||||||
|
||||||||
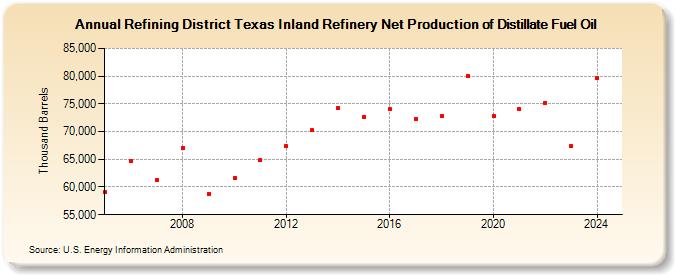
| Refining District Texas Inland Refinery Net Production of Distillate Fuel Oil (Thousand Barrels) | ||||||||
| Decade | Year-0 | Year-1 | Year-2 | Year-3 | Year-4 | Year-5 | Year-6 | Year-7 | Year-8 | Year-9 |
|---|---|---|---|---|---|---|---|---|---|---|
| 2000's | 59,053 | 64,752 | 61,280 | 67,071 | 58,800 | |||||
| 2010's | 61,610 | 64,796 | 67,355 | 70,201 | 74,236 | 72,662 | 74,006 | 72,196 | 72,718 | 80,108 |
| 2020's | 72,829 | 73,985 | 75,116 | 67,221 |
| - = No Data Reported; -- = Not Applicable; NA = Not Available; W = Withheld to avoid disclosure of individual company data. |
| Release Date: 3/29/2024 |
| Next Release Date: 8/30/2024 |