|
Download Data (XLS File) |
|
||||||||
|
||||||||
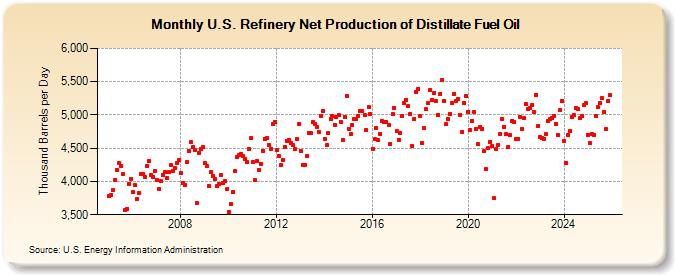
| U.S. Refinery Net Production of Distillate Fuel Oil (Thousand Barrels per Day) | ||||||||
| Year | Jan | Feb | Mar | Apr | May | Jun | Jul | Aug | Sep | Oct | Nov | Dec |
|---|---|---|---|---|---|---|---|---|---|---|---|---|
| 2005 | 3,777 | 3,797 | 3,874 | 4,028 | 4,179 | 4,274 | 4,236 | 4,108 | 3,570 | 3,585 | 3,966 | 4,044 |
| 2006 | 3,840 | 3,941 | 3,736 | 3,833 | 4,105 | 4,107 | 4,065 | 4,234 | 4,300 | 4,090 | 4,070 | 4,159 |
| 2007 | 4,027 | 3,883 | 4,009 | 4,102 | 4,142 | 4,050 | 4,145 | 4,244 | 4,158 | 4,208 | 4,278 | 4,326 |
| 2008 | 4,130 | 3,980 | 3,953 | 4,287 | 4,459 | 4,587 | 4,523 | 4,466 | 3,681 | 4,435 | 4,489 | 4,511 |
| 2009 | 4,277 | 4,226 | 3,936 | 4,136 | 4,086 | 4,042 | 3,930 | 3,964 | 4,093 | 3,977 | 4,013 | 3,879 |
| 2010 | 3,545 | 3,654 | 3,835 | 4,153 | 4,365 | 4,401 | 4,416 | 4,385 | 4,335 | 4,296 | 4,493 | 4,647 |
| 2011 | 4,295 | 4,022 | 4,307 | 4,173 | 4,269 | 4,460 | 4,639 | 4,646 | 4,551 | 4,492 | 4,858 | 4,896 |
| 2012 | 4,474 | 4,388 | 4,245 | 4,329 | 4,523 | 4,608 | 4,630 | 4,571 | 4,542 | 4,486 | 4,645 | 4,860 |
| 2013 | 4,465 | 4,246 | 4,252 | 4,381 | 4,734 | 4,733 | 4,890 | 4,866 | 4,825 | 4,748 | 4,987 | 5,063 |
| 2014 | 4,642 | 4,542 | 4,734 | 4,941 | 4,982 | 4,852 | 4,976 | 5,000 | 4,894 | 4,617 | 4,972 | 5,287 |
| 2015 | 4,794 | 4,710 | 4,851 | 4,942 | 4,938 | 4,988 | 5,052 | 5,060 | 5,005 | 4,771 | 5,126 | 5,008 |
| 2016 | 4,495 | 4,631 | 4,809 | 4,617 | 4,719 | 4,906 | 4,893 | 4,892 | 4,853 | 4,564 | 5,010 | 5,106 |
| 2017 | 4,752 | 4,629 | 4,731 | 4,986 | 5,184 | 5,230 | 5,130 | 5,021 | 4,527 | 4,941 | 5,338 | 5,394 |
| 2018 | 4,981 | 4,576 | 4,798 | 5,085 | 5,177 | 5,381 | 5,224 | 5,336 | 5,204 | 5,004 | 5,320 | 5,531 |
| 2019 | 5,215 | 4,867 | 4,935 | 5,019 | 5,174 | 5,321 | 5,213 | 5,238 | 5,005 | 4,748 | 5,186 | 5,279 |
| 2020 | 5,049 | 4,771 | 4,912 | 5,046 | 4,789 | 4,560 | 4,813 | 4,793 | 4,459 | 4,182 | 4,496 | 4,598 |
| 2021 | 4,526 | 3,745 | 4,484 | 4,555 | 4,710 | 4,946 | 4,824 | 4,709 | 4,518 | 4,691 | 4,914 | 4,890 |
| 2022 | 4,631 | 4,644 | 4,963 | 4,794 | 4,950 | 5,159 | 5,090 | 5,107 | 5,147 | 5,044 | 5,303 | 4,836 |
| 2023 | 4,665 | 4,658 | 4,642 | 4,715 | 4,925 | 4,959 | 4,960 | 4,999 | 4,884 | 4,712 | 5,082 | 5,210 |
| 2024 | 4,612 | 4,282 | ||||||||||
| - = No Data Reported; -- = Not Applicable; NA = Not Available; W = Withheld to avoid disclosure of individual company data. |
| Release Date: 4/30/2024 |
| Next Release Date: 5/31/2024 |