|
Download Data (XLS File) |
|
||||||||
|
||||||||
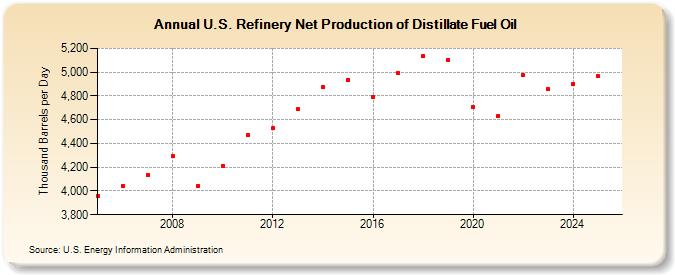
| U.S. Refinery Net Production of Distillate Fuel Oil (Thousand Barrels per Day) | ||||||||
| Decade | Year-0 | Year-1 | Year-2 | Year-3 | Year-4 | Year-5 | Year-6 | Year-7 | Year-8 | Year-9 |
|---|---|---|---|---|---|---|---|---|---|---|
| 2000's | 3,954 | 4,040 | 4,133 | 4,294 | 4,045 | |||||
| 2010's | 4,214 | 4,470 | 4,526 | 4,686 | 4,872 | 4,938 | 4,792 | 4,991 | 5,138 | 5,102 |
| 2020's | 4,706 | 4,632 | 4,974 | 4,869 |
| - = No Data Reported; -- = Not Applicable; NA = Not Available; W = Withheld to avoid disclosure of individual company data. |
| Release Date: 3/29/2024 |
| Next Release Date: 8/30/2024 |