|
Download Data (XLS File) |
|
||||||||
|
||||||||
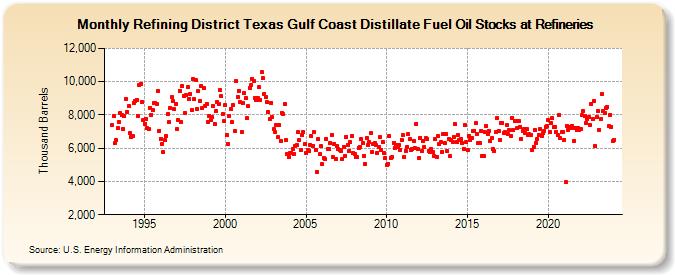
| Refining District Texas Gulf Coast Distillate Fuel Oil Stocks at Refineries (Thousand Barrels) | ||||||||
| Year | Jan | Feb | Mar | Apr | May | Jun | Jul | Aug | Sep | Oct | Nov | Dec |
|---|---|---|---|---|---|---|---|---|---|---|---|---|
| 1993 | 7,368 | 7,908 | 6,334 | 6,466 | 7,202 | 7,586 | 8,097 | 7,985 | 7,179 | 7,938 | 8,973 | 8,179 |
| 1994 | 8,536 | 6,915 | 6,689 | 6,738 | 8,720 | 8,849 | 8,918 | 7,952 | 9,826 | 9,886 | 8,801 | 7,669 |
| 1995 | 7,471 | 7,783 | 7,210 | 7,124 | 8,440 | 8,025 | 8,269 | 8,724 | 8,713 | 8,665 | 9,446 | 7,053 |
| 1996 | 6,577 | 6,279 | 5,753 | 6,487 | 6,717 | 8,051 | 7,571 | 8,429 | 9,090 | 8,833 | 8,338 | 8,684 |
| 1997 | 7,143 | 7,668 | 9,465 | 7,602 | 9,739 | 9,152 | 8,131 | 9,190 | 9,680 | 8,984 | 9,268 | 8,304 |
| 1998 | 10,175 | 8,933 | 10,078 | 8,377 | 9,409 | 8,846 | 9,743 | 8,423 | 9,604 | 8,556 | 8,686 | 7,598 |
| 1999 | 7,951 | 7,676 | 7,862 | 8,542 | 7,475 | 8,215 | 8,773 | 8,680 | 9,489 | 9,120 | 8,068 | 7,627 |
| 2000 | 8,582 | 6,817 | 6,278 | 7,965 | 8,345 | 7,563 | 8,595 | 7,046 | 10,052 | 9,100 | 9,457 | 8,785 |
| 2001 | 6,986 | 8,687 | 9,292 | 9,008 | 7,798 | 8,521 | 9,639 | 9,770 | 10,160 | 10,054 | 8,995 | 8,899 |
| 2002 | 9,041 | 9,650 | 8,889 | 10,552 | 10,199 | 9,287 | 9,082 | 8,772 | 8,167 | 7,768 | 8,734 | 7,848 |
| 2003 | 7,132 | 6,952 | 7,404 | 6,646 | 7,379 | 6,446 | 8,120 | 8,044 | 8,651 | 6,478 | 5,666 | 5,452 |
| 2004 | 5,700 | 5,726 | 5,948 | 5,678 | 6,139 | 6,212 | 6,947 | 6,487 | 5,864 | 6,798 | 6,965 | 6,260 |
| 2005 | 5,722 | 5,896 | 5,840 | 6,210 | 6,722 | 6,159 | 6,958 | 5,896 | 4,569 | 6,542 | 5,644 | 6,109 |
| 2006 | 5,045 | 5,389 | 5,356 | 6,556 | 5,958 | 5,980 | 6,306 | 6,781 | 5,474 | 6,256 | 5,344 | 6,127 |
| 2007 | 5,962 | 5,878 | 5,836 | 5,361 | 6,099 | 5,556 | 6,689 | 6,211 | 5,840 | 6,350 | 6,756 | 5,717 |
| 2008 | 5,634 | 5,446 | 5,460 | 6,021 | 6,078 | 6,535 | 6,298 | 5,545 | 5,048 | 6,592 | 6,220 | 6,362 |
| 2009 | 6,895 | 5,798 | 6,227 | 6,332 | 6,163 | 5,731 | 6,045 | 6,664 | 5,915 | 6,350 | 5,690 | 5,385 |
| 2010 | 4,974 | 5,055 | 6,740 | 5,428 | 5,475 | 6,335 | 6,031 | 6,192 | 6,085 | 6,182 | 5,917 | 6,501 |
| 2011 | 6,776 | 5,498 | 5,832 | 6,085 | 6,823 | 6,548 | 5,866 | 5,966 | 6,406 | 6,006 | 7,471 | 5,950 |
| 2012 | 5,398 | 6,633 | 5,810 | 6,447 | 6,080 | 6,607 | 6,540 | 5,842 | 5,792 | 5,964 | 5,751 | 5,541 |
| 2013 | 6,582 | 5,493 | 6,723 | 6,225 | 6,364 | 5,791 | 6,829 | 6,293 | 6,853 | 5,831 | 6,536 | 5,514 |
| 2014 | 6,472 | 6,393 | 6,689 | 7,428 | 6,366 | 6,800 | 6,507 | 6,540 | 6,287 | 5,931 | 7,390 | 6,371 |
| 2015 | 5,862 | 6,757 | 6,502 | 6,629 | 7,053 | 7,052 | 7,504 | 6,881 | 6,330 | 6,328 | 7,047 | 5,553 |
| 2016 | 5,506 | 6,979 | 7,343 | 6,856 | 7,038 | 6,416 | 6,611 | 5,966 | 5,841 | 6,965 | 7,826 | 7,012 |
| 2017 | 6,512 | 7,517 | 7,532 | 6,907 | 6,952 | 7,385 | 6,848 | 7,073 | 6,748 | 7,832 | 7,080 | 7,652 |
| 2018 | 7,639 | 7,200 | 7,650 | 7,300 | 6,570 | 7,051 | 7,141 | 6,909 | 7,132 | 6,808 | 6,834 | 6,818 |
| 2019 | 5,891 | 6,067 | 7,120 | 6,317 | 6,562 | 6,764 | 7,154 | 6,745 | 6,904 | 7,050 | 7,290 | 7,339 |
| 2020 | 7,671 | 6,963 | 7,487 | 7,799 | 7,263 | 7,266 | 6,959 | 6,777 | 8,010 | 6,606 | 6,963 | 6,999 |
| 2021 | 6,519 | 3,951 | 7,350 | 7,090 | 7,257 | 7,230 | 7,363 | 6,436 | 7,235 | 7,092 | 7,236 | 7,121 |
| 2022 | 7,126 | 7,980 | 8,219 | 7,921 | 7,526 | 7,739 | 7,860 | 7,423 | 8,667 | 7,761 | 8,823 | 6,120 |
| 2023 | 7,860 | 8,239 | 7,120 | 7,770 | 9,269 | 8,254 | 8,119 | 8,407 | 8,471 | 7,328 | 8,013 | 7,293 |
| 2024 | 6,440 | |||||||||||
| - = No Data Reported; -- = Not Applicable; NA = Not Available; W = Withheld to avoid disclosure of individual company data. |
| Release Date: 3/29/2024 |
| Next Release Date: 4/30/2024 |
Referring Pages: