|
Download Data (XLS File) |
|
||||||||
|
||||||||
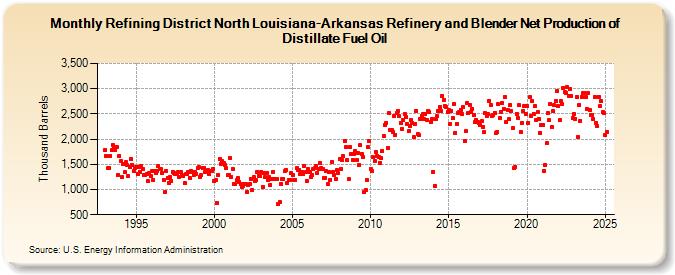
| Refining District North Louisiana-Arkansas Refinery and Blender Net Production of Distillate Fuel Oil (Thousand Barrels) | ||||||||
| Year | Jan | Feb | Mar | Apr | May | Jun | Jul | Aug | Sep | Oct | Nov | Dec |
|---|---|---|---|---|---|---|---|---|---|---|---|---|
| 1993 | 1,781 | 1,666 | 1,417 | 1,425 | 1,672 | 1,782 | 1,885 | 1,846 | 1,780 | 1,835 | 1,288 | 1,665 |
| 1994 | 1,561 | 1,239 | 1,511 | 1,338 | 1,545 | 1,477 | 1,271 | 1,444 | 1,602 | 1,489 | 1,364 | 1,427 |
| 1995 | 1,442 | 1,300 | 1,451 | 1,353 | 1,467 | 1,410 | 1,295 | 1,297 | 1,311 | 1,160 | 1,318 | 1,260 |
| 1996 | 1,367 | 1,193 | 1,363 | 1,331 | 1,374 | 1,457 | 1,410 | 1,406 | 1,330 | 1,188 | 957 | 1,370 |
| 1997 | 1,236 | 1,136 | 1,253 | 1,168 | 1,355 | 1,328 | 1,302 | 1,314 | 1,338 | 1,257 | 1,343 | 1,288 |
| 1998 | 1,259 | 1,121 | 1,298 | 1,307 | 1,339 | 1,236 | 1,368 | 1,345 | 1,291 | 1,349 | 1,313 | 1,418 |
| 1999 | 1,441 | 1,254 | 1,281 | 1,428 | 1,431 | 1,354 | 1,362 | 1,392 | 1,302 | 1,361 | 1,375 | 1,412 |
| 2000 | 1,165 | 1,184 | 731 | 1,288 | 1,596 | 1,509 | 1,556 | 1,534 | 1,495 | 1,425 | 1,279 | 1,295 |
| 2001 | 1,626 | 1,255 | 1,410 | 1,110 | 1,104 | 1,182 | 1,221 | 1,150 | 1,101 | 1,055 | 1,068 | 1,114 |
| 2002 | 1,113 | 941 | 1,084 | 1,106 | 1,218 | 990 | 1,243 | 1,159 | 1,180 | 1,357 | 1,269 | 1,263 |
| 2003 | 1,354 | 1,057 | 1,334 | 1,240 | 1,334 | 1,192 | 1,248 | 1,093 | 1,207 | 1,356 | 1,215 | 1,199 |
| 2004 | 1,216 | 706 | 745 | 1,111 | 1,212 | 1,217 | 1,359 | 1,390 | 1,132 | 1,184 | 1,198 | 1,328 |
| 2005 | 1,282 | 1,190 | 1,194 | 1,424 | 1,389 | 1,388 | 1,312 | 1,346 | 1,315 | 1,473 | 1,342 | 1,170 |
| 2006 | 1,399 | 1,352 | 1,249 | 1,296 | 1,411 | 1,419 | 1,466 | 1,336 | 1,403 | 1,522 | 1,424 | 1,410 |
| 2007 | 1,224 | 1,228 | 1,369 | 1,118 | 1,340 | 1,195 | 1,544 | 1,348 | 1,290 | 1,208 | 1,378 | 1,324 |
| 2008 | 1,597 | 1,408 | 1,576 | 1,659 | 1,966 | 1,835 | 1,576 | 1,200 | 1,849 | 1,701 | 1,581 | 1,714 |
| 2009 | 1,761 | 1,584 | 1,726 | 1,486 | 1,875 | 1,713 | 1,651 | 955 | 992 | 1,183 | 1,840 | 1,955 |
| 2010 | 1,413 | 1,358 | 1,636 | 1,560 | 1,743 | 1,663 | 1,637 | 1,534 | 1,618 | 1,765 | 2,065 | 2,276 |
| 2011 | 2,329 | 1,826 | 2,512 | 2,176 | 2,175 | 2,150 | 2,462 | 2,089 | 2,524 | 2,558 | 2,451 | 2,321 |
| 2012 | 2,208 | 2,379 | 2,504 | 2,439 | 2,309 | 2,151 | 2,252 | 2,383 | 2,323 | 2,037 | 2,306 | 2,560 |
| 2013 | 2,104 | 2,073 | 2,401 | 2,467 | 2,490 | 2,393 | 2,489 | 2,383 | 2,558 | 2,536 | 2,336 | 2,399 |
| 2014 | 1,355 | 1,071 | 2,399 | 2,453 | 2,557 | 2,628 | 2,560 | 2,861 | 2,770 | 2,661 | 2,632 | 2,536 |
| 2015 | 2,576 | 2,298 | 2,557 | 2,413 | 2,698 | 2,130 | 2,309 | 2,516 | 2,530 | 2,587 | 2,495 | 2,634 |
| 2016 | 1,961 | 2,154 | 2,713 | 2,523 | 2,678 | 2,543 | 2,604 | 2,478 | 2,334 | 2,382 | 2,344 | 2,314 |
| 2017 | 2,282 | 2,350 | 2,249 | 2,134 | 2,510 | 2,449 | 2,496 | 2,757 | 2,684 | 2,465 | 2,478 | 2,525 |
| 2018 | 2,115 | 2,137 | 2,695 | 2,415 | 2,546 | 2,717 | 2,588 | 2,839 | 2,349 | 2,581 | 2,390 | 2,678 |
| 2019 | 2,551 | 2,213 | 1,427 | 1,454 | 2,505 | 2,424 | 2,671 | 2,140 | 2,327 | 2,560 | 2,657 | 2,499 |
| 2020 | 2,655 | 2,327 | 2,831 | 2,465 | 2,760 | 2,503 | 2,650 | 2,379 | 2,538 | 2,405 | 2,128 | 2,272 |
| 2021 | 2,281 | 1,373 | 1,480 | 1,914 | 2,521 | 2,370 | 2,703 | 2,243 | 2,562 | 2,670 | 2,760 | 2,951 |
| 2022 | 2,654 | 2,377 | 2,755 | 2,690 | 3,018 | 2,939 | 2,921 | 3,025 | 2,864 | 2,991 | 2,853 | 2,413 |
| 2023 | 2,504 | 2,406 | 2,836 | 2,046 | 2,680 | 2,360 | 2,845 | 2,905 | 2,902 | 2,767 | 2,619 | 2,854 |
| 2024 | 2,582 | 2,486 | 2,476 | 2,390 | ||||||||
| - = No Data Reported; -- = Not Applicable; NA = Not Available; W = Withheld to avoid disclosure of individual company data. |
| Release Date: 6/28/2024 |
| Next Release Date: 7/31/2024 |