|
Download Data (XLS File) |
|
||||||||
|
||||||||
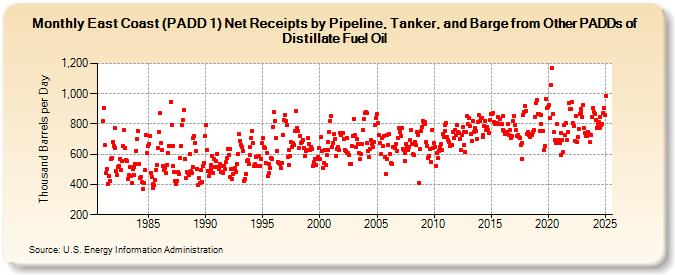
| East Coast (PADD 1) Net Receipts by Pipeline, Tanker, and Barge from Other PADDs of Distillate Fuel Oil (Thousand Barrels per Day) | ||||||||
| Year | Jan | Feb | Mar | Apr | May | Jun | Jul | Aug | Sep | Oct | Nov | Dec |
|---|---|---|---|---|---|---|---|---|---|---|---|---|
| 1981 | 819 | 904 | 658 | 475 | 502 | 404 | 458 | 422 | 566 | 574 | 678 | 656 |
| 1982 | 773 | 642 | 489 | 464 | 514 | 524 | 570 | 497 | 552 | 653 | 760 | 644 |
| 1983 | 560 | 552 | 437 | 462 | 515 | 453 | 408 | 502 | 462 | 517 | 538 | 622 |
| 1984 | 700 | 752 | 537 | 441 | 449 | 414 | 372 | 413 | 494 | 725 | 605 | 656 |
| 1985 | 668 | 722 | 479 | 450 | 379 | 404 | 394 | 430 | 498 | 526 | 639 | 746 |
| 1986 | 870 | 674 | 629 | 520 | 494 | 508 | 479 | 532 | 610 | 652 | 654 | 944 |
| 1987 | 794 | 654 | 524 | 481 | 420 | 403 | 426 | 485 | 468 | 574 | 657 | 793 |
| 1988 | 825 | 890 | 568 | 442 | 483 | 479 | 460 | 602 | 488 | 479 | 516 | 710 |
| 1989 | 722 | 675 | 619 | 504 | 395 | 443 | 411 | 495 | 417 | 519 | 540 | 718 |
| 1990 | 791 | 626 | 491 | 456 | 485 | 505 | 527 | 590 | 476 | 567 | 518 | 552 |
| 1991 | 604 | 514 | 504 | 535 | 482 | 519 | 475 | 524 | 503 | 546 | 574 | 637 |
| 1992 | 595 | 635 | 451 | 502 | 434 | 467 | 505 | 508 | 484 | 536 | 600 | 735 |
| 1993 | 688 | 663 | 646 | 618 | 420 | 433 | 469 | 554 | 565 | 535 | 597 | 645 |
| 1994 | 709 | 756 | 672 | 524 | 533 | 584 | 523 | 587 | 585 | 520 | 566 | 671 |
| 1995 | 706 | 647 | 639 | 544 | 609 | 455 | 534 | 475 | 507 | 578 | 567 | 781 |
| 1996 | 881 | 819 | 704 | 619 | 549 | 541 | 535 | 506 | 545 | 726 | 829 | 862 |
| 1997 | 817 | 792 | 581 | 529 | 628 | 589 | 679 | 650 | 675 | 662 | 751 | 884 |
| 1998 | 771 | 753 | 640 | 723 | 677 | 680 | 693 | 642 | 588 | 622 | 628 | 707 |
| 1999 | 666 | 668 | 628 | 650 | 636 | 524 | 551 | 569 | 527 | 571 | 582 | 642 |
| 2000 | 567 | 717 | 623 | 511 | 542 | 628 | 527 | 598 | 629 | 681 | 749 | 822 |
| 2001 | 856 | 651 | 677 | 735 | 702 | 585 | 637 | 645 | 629 | 739 | 729 | 742 |
| 2002 | 743 | 703 | 631 | 618 | 609 | 706 | 610 | 592 | 533 | 537 | 655 | 720 |
| 2003 | 835 | 724 | 649 | 699 | 668 | 610 | 566 | 603 | 665 | 758 | 834 | 874 |
| 2004 | 877 | 875 | 673 | 619 | 582 | 634 | 692 | 669 | 647 | 681 | 796 | 837 |
| 2005 | 863 | 806 | 725 | 674 | 601 | 705 | 654 | 719 | 579 | 469 | 568 | 724 |
| 2006 | 661 | 735 | 603 | 543 | 537 | 645 | 645 | 644 | 667 | 624 | 704 | 771 |
| 2007 | 746 | 722 | 776 | 637 | 631 | 558 | 605 | 670 | 649 | 629 | 651 | 695 |
| 2008 | 760 | 670 | 601 | 597 | 684 | 660 | 745 | 730 | 413 | 634 | 755 | 777 |
| 2009 | 821 | 809 | 812 | 803 | 681 | 655 | 578 | 587 | 632 | 550 | 761 | 639 |
| 2010 | 675 | 649 | 521 | 610 | 573 | 622 | 645 | 665 | 628 | 733 | 717 | 755 |
| 2011 | 795 | 804 | 713 | 697 | 680 | 652 | 664 | 662 | 747 | 706 | 760 | 727 |
| 2012 | 793 | 749 | 738 | 702 | 629 | 728 | 780 | 749 | 664 | 616 | 745 | 851 |
| 2013 | 801 | 837 | 786 | 732 | 685 | 821 | 750 | 772 | 753 | 698 | 813 | 860 |
| 2014 | 819 | 839 | 841 | 728 | 711 | 784 | 822 | 760 | 782 | 759 | 739 | 826 |
| 2015 | 869 | 864 | 870 | 815 | 799 | 800 | 806 | 848 | 801 | 834 | 800 | 803 |
| 2016 | 761 | 852 | 752 | 734 | 750 | 746 | 800 | 727 | 760 | 704 | 718 | 817 |
| 2017 | 854 | 791 | 757 | 721 | 726 | 716 | 707 | 660 | 571 | 677 | 862 | 881 |
| 2018 | 922 | 885 | 731 | 749 | 726 | 715 | 736 | 729 | 744 | 759 | 848 | 938 |
| 2019 | 957 | 868 | 868 | 755 | 798 | 862 | 756 | 756 | 630 | 652 | 967 | 907 |
| 2020 | 911 | 923 | 842 | 1,057 | 1,168 | 866 | 744 | 691 | 677 | 797 | 689 | 696 |
| 2021 | 673 | 739 | 592 | 691 | 612 | 792 | 725 | 805 | 692 | 749 | 936 | 896 |
| 2022 | 902 | 946 | 806 | 789 | 690 | 850 | 682 | 714 | 766 | 866 | 902 | 873 |
| 2023 | 846 | 925 | 775 | 743 | 720 | 721 | 744 | 737 | 679 | 746 | 843 | 903 |
| 2024 | 876 | |||||||||||
| - = No Data Reported; -- = Not Applicable; NA = Not Available; W = Withheld to avoid disclosure of individual company data. |
| Release Date: 3/29/2024 |
| Next Release Date: 4/30/2024 |