|
Download Data (XLS File) |
|
||||||||
|
||||||||
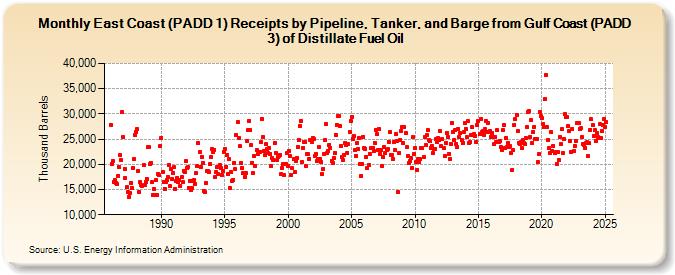
| East Coast (PADD 1) Receipts by Pipeline, Tanker, and Barge from Gulf Coast (PADD 3) of Distillate Fuel Oil (Thousand Barrels) | ||||||||
| Year | Jan | Feb | Mar | Apr | May | Jun | Jul | Aug | Sep | Oct | Nov | Dec |
|---|---|---|---|---|---|---|---|---|---|---|---|---|
| 1986 | 27,828 | 20,116 | 20,726 | 16,574 | 16,797 | 16,315 | 16,054 | 17,768 | 19,462 | 21,776 | 20,844 | 30,366 |
| 1987 | 25,372 | 19,150 | 17,290 | 15,412 | 14,443 | 13,606 | 14,209 | 16,349 | 15,369 | 19,332 | 21,030 | 25,810 |
| 1988 | 26,408 | 26,973 | 18,750 | 14,519 | 16,461 | 15,901 | 15,678 | 19,801 | 15,990 | 16,585 | 17,175 | 23,413 |
| 1989 | 23,442 | 19,998 | 20,313 | 16,449 | 13,895 | 15,060 | 13,935 | 16,850 | 13,970 | 18,102 | 17,788 | 23,585 |
| 1990 | 25,281 | 18,507 | 16,409 | 15,151 | 16,513 | 16,893 | 17,395 | 19,779 | 15,627 | 19,041 | 17,100 | 18,280 |
| 1991 | 19,397 | 15,169 | 16,709 | 17,319 | 16,510 | 16,813 | 15,783 | 17,399 | 16,423 | 18,732 | 18,425 | 20,582 |
| 1992 | 19,299 | 19,451 | 15,340 | 16,718 | 14,913 | 15,240 | 16,627 | 16,920 | 16,081 | 18,207 | 19,619 | 24,237 |
| 1993 | 22,410 | 19,530 | 21,490 | 20,268 | 14,785 | 14,590 | 16,315 | 18,643 | 18,664 | 18,464 | 19,987 | 21,472 |
| 1994 | 23,050 | 22,371 | 22,920 | 17,500 | 18,569 | 19,446 | 18,043 | 19,897 | 19,280 | 17,867 | 18,728 | 22,446 |
| 1995 | 23,117 | 19,537 | 21,944 | 18,084 | 20,971 | 15,280 | 18,392 | 16,746 | 16,854 | 20,356 | 18,975 | 25,850 |
| 1996 | 28,371 | 25,282 | 23,554 | 20,162 | 19,313 | 18,215 | 18,244 | 17,562 | 18,203 | 24,582 | 26,726 | 28,622 |
| 1997 | 26,725 | 23,789 | 20,273 | 18,215 | 21,661 | 19,722 | 22,875 | 22,084 | 22,452 | 22,487 | 24,442 | 29,079 |
| 1998 | 25,460 | 22,669 | 21,754 | 23,954 | 22,983 | 22,195 | 23,329 | 22,085 | 19,668 | 21,220 | 20,858 | 24,242 |
| 1999 | 22,326 | 20,760 | 21,466 | 21,720 | 21,936 | 18,007 | 19,255 | 19,999 | 17,795 | 20,083 | 20,088 | 22,209 |
| 2000 | 19,705 | 22,664 | 21,694 | 17,843 | 19,250 | 21,044 | 18,422 | 20,733 | 21,283 | 23,488 | 24,901 | 27,683 |
| 2001 | 28,534 | 20,466 | 23,319 | 24,430 | 24,376 | 19,610 | 22,025 | 21,945 | 21,104 | 24,859 | 24,339 | 25,193 |
| 2002 | 25,047 | 21,629 | 22,061 | 20,657 | 20,979 | 23,521 | 21,023 | 20,515 | 18,121 | 19,092 | 22,082 | 24,826 |
| 2003 | 27,985 | 22,180 | 22,542 | 23,904 | 23,258 | 20,685 | 20,337 | 21,314 | 22,255 | 25,898 | 27,860 | 29,600 |
| 2004 | 29,616 | 27,644 | 23,595 | 21,524 | 20,851 | 21,883 | 24,197 | 23,769 | 22,336 | 23,966 | 26,447 | 28,596 |
| 2005 | 29,474 | 25,046 | 25,701 | 22,786 | 21,736 | 24,248 | 23,068 | 25,196 | 20,012 | 17,708 | 20,092 | 25,501 |
| 2006 | 23,272 | 23,104 | 21,492 | 19,257 | 19,821 | 22,115 | 23,184 | 23,208 | 23,187 | 22,561 | 24,289 | 26,889 |
| 2007 | 25,938 | 22,748 | 27,026 | 22,089 | 22,804 | 19,670 | 21,410 | 23,426 | 22,232 | 22,777 | 22,943 | 24,506 |
| 2008 | 26,404 | 21,916 | 21,938 | 21,031 | 24,364 | 22,798 | 25,971 | 24,605 | 14,521 | 22,269 | 24,827 | 26,629 |
| 2009 | 27,495 | 24,181 | 27,487 | 26,190 | 23,380 | 21,689 | 20,165 | 20,690 | 21,284 | 19,344 | 25,318 | 22,113 |
| 2010 | 23,246 | 20,475 | 18,897 | 20,994 | 20,445 | 20,979 | 23,199 | 23,155 | 21,445 | 25,450 | 23,816 | 25,807 |
| 2011 | 26,723 | 24,866 | 24,650 | 23,288 | 23,637 | 22,154 | 23,032 | 23,040 | 24,956 | 24,363 | 25,180 | 24,786 |
| 2012 | 26,511 | 23,554 | 24,950 | 23,278 | 21,701 | 24,285 | 26,254 | 25,491 | 22,127 | 21,066 | 24,099 | 28,266 |
| 2013 | 26,472 | 24,848 | 26,728 | 24,033 | 23,447 | 27,056 | 25,386 | 26,127 | 24,759 | 24,199 | 26,426 | 28,228 |
| 2014 | 27,056 | 25,430 | 28,531 | 24,317 | 24,342 | 25,836 | 27,373 | 25,742 | 25,992 | 25,696 | 24,435 | 27,721 |
| 2015 | 28,579 | 25,929 | 28,970 | 26,394 | 26,525 | 25,837 | 26,982 | 28,594 | 26,367 | 28,212 | 26,395 | 26,580 |
| 2016 | 25,477 | 26,278 | 25,335 | 24,101 | 25,454 | 24,383 | 26,712 | 24,477 | 24,611 | 23,405 | 22,848 | 26,768 |
| 2017 | 27,717 | 23,330 | 25,226 | 23,412 | 24,291 | 23,406 | 23,588 | 22,173 | 18,892 | 22,774 | 27,866 | 29,018 |
| 2018 | 29,781 | 26,601 | 24,253 | 24,055 | 24,456 | 23,296 | 24,778 | 24,294 | 24,022 | 25,160 | 27,311 | 30,293 |
| 2019 | 30,555 | 25,427 | 28,761 | 24,262 | 26,409 | 27,468 | 25,094 | 24,933 | 20,411 | 21,982 | 30,374 | 29,531 |
| 2020 | 29,128 | 27,952 | 27,462 | 33,002 | 37,762 | 27,368 | 24,918 | 23,208 | 22,153 | 26,354 | 22,680 | 23,645 |
| 2021 | 22,313 | 22,396 | 20,097 | 22,517 | 20,764 | 25,450 | 24,028 | 26,980 | 22,292 | 25,037 | 29,910 | 29,350 |
| 2022 | 29,376 | 27,553 | 26,659 | 24,561 | 22,451 | 27,024 | 22,592 | 23,675 | 24,611 | 28,118 | 28,118 | 28,122 |
| 2023 | 27,080 | 27,109 | 25,331 | 24,022 | 23,914 | 23,313 | 24,168 | 24,385 | 21,634 | 24,157 | 26,856 | 28,910 |
| 2024 | 27,729 | |||||||||||
| - = No Data Reported; -- = Not Applicable; NA = Not Available; W = Withheld to avoid disclosure of individual company data. |
| Release Date: 3/29/2024 |
| Next Release Date: 4/30/2024 |