|
Download Data (XLS File) |
|
||||||||
|
||||||||
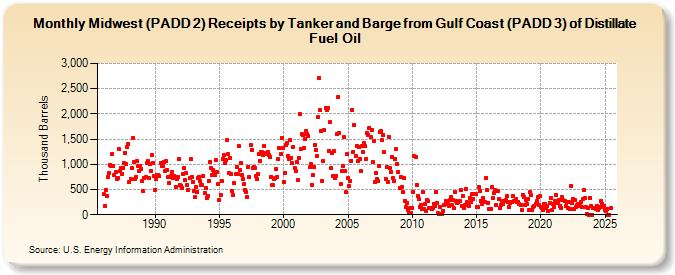
| Midwest (PADD 2) Receipts by Tanker and Barge from Gulf Coast (PADD 3) of Distillate Fuel Oil (Thousand Barrels) | ||||||||
| Year | Jan | Feb | Mar | Apr | May | Jun | Jul | Aug | Sep | Oct | Nov | Dec |
|---|---|---|---|---|---|---|---|---|---|---|---|---|
| 1986 | 407 | 182 | 495 | 378 | 739 | 836 | 996 | 973 | 1,207 | 972 | 794 | 842 |
| 1987 | 716 | 737 | 1,296 | 865 | 933 | 817 | 936 | 1,025 | 1,223 | 1,000 | 1,346 | 1,401 |
| 1988 | 657 | 706 | 922 | 1,525 | 1,037 | 707 | 749 | 1,062 | 960 | 863 | 965 | 907 |
| 1989 | 669 | 461 | 722 | 740 | 1,029 | 1,070 | 725 | 1,008 | 872 | 1,191 | 1,024 | 773 |
| 1990 | 499 | 713 | 785 | 789 | 771 | 1,021 | 973 | 967 | 1,039 | 877 | 1,057 | 893 |
| 1991 | 740 | 622 | 743 | 774 | 856 | 729 | 763 | 558 | 710 | 758 | 1,101 | 581 |
| 1992 | 576 | 538 | 810 | 918 | 686 | 827 | 580 | 498 | 726 | 1,104 | 739 | 654 |
| 1993 | 473 | 342 | 553 | 453 | 735 | 745 | 662 | 592 | 596 | 773 | 440 | 539 |
| 1994 | 337 | 380 | 665 | 1,045 | 919 | 790 | 885 | 852 | 791 | 1,085 | 852 | 617 |
| 1995 | 286 | 389 | 664 | 1,098 | 1,175 | 1,024 | 1,076 | 1,475 | 1,204 | 821 | 1,132 | 804 |
| 1996 | 469 | 384 | 629 | 802 | 940 | 803 | 1,363 | 895 | 1,033 | 780 | 707 | 604 |
| 1997 | 494 | 458 | 345 | 952 | 746 | 1,378 | 1,288 | 927 | 945 | 935 | 769 | 717 |
| 1998 | 805 | 1,210 | 1,073 | 1,241 | 1,236 | 1,176 | 1,364 | 1,227 | 1,204 | 1,252 | 1,193 | 1,137 |
| 1999 | 758 | 580 | 592 | 700 | 720 | 903 | 750 | 1,104 | 1,316 | 1,206 | 1,518 | 1,324 |
| 2000 | 648 | 833 | 1,377 | 1,419 | 1,173 | 1,103 | 1,485 | 1,134 | 1,023 | 1,350 | 921 | 877 |
| 2001 | 1,048 | 680 | 1,133 | 1,991 | 1,309 | 1,597 | 1,579 | 1,321 | 1,497 | 1,654 | 1,603 | 1,558 |
| 2002 | 938 | 1,005 | 590 | 784 | 944 | 1,384 | 1,283 | 1,160 | 1,940 | 2,716 | 2,075 | 1,651 |
| 2003 | 671 | 1,061 | 1,680 | 2,107 | 2,080 | 2,125 | 1,271 | 1,833 | 931 | 1,220 | 764 | 1,254 |
| 2004 | 737 | 768 | 1,607 | 2,340 | 1,625 | 600 | 869 | 972 | 1,535 | 863 | 441 | 1,198 |
| 2005 | 719 | 565 | 664 | 1,066 | 2,085 | 1,252 | 1,777 | 1,159 | 1,368 | 1,073 | 1,344 | 1,106 |
| 2006 | 860 | 1,354 | 1,239 | 1,415 | 1,357 | 1,099 | 1,618 | 1,588 | 1,726 | 1,545 | 1,676 | 1,046 |
| 2007 | 1,458 | 658 | 827 | 706 | 662 | 960 | 1,649 | 1,651 | 1,480 | 1,583 | 1,239 | 717 |
| 2008 | 941 | 657 | 1,550 | 917 | 855 | 1,138 | 722 | 676 | 1,111 | 1,296 | 1,012 | 854 |
| 2009 | 536 | 751 | 549 | 455 | 734 | 280 | 148 | 240 | 101 | 25 | 124 | 35 |
| 2010 | 138 | 453 | 1,157 | 1,136 | 592 | 373 | 320 | 157 | 193 | 116 | 441 | 110 |
| 2011 | 219 | 68 | 292 | 265 | 124 | 143 | 104 | 141 | 222 | 164 | 454 | 231 |
| 2012 | 26 | 5 | 148 | 24 | 19 | 74 | 187 | 273 | 229 | 212 | 173 | 287 |
| 2013 | 356 | 198 | 285 | 127 | 452 | 278 | 223 | 252 | 268 | 484 | 172 | 376 |
| 2014 | 125 | 189 | 515 | 246 | 194 | 176 | 332 | 244 | 417 | 307 | 418 | 417 |
| 2015 | 159 | 150 | 543 | 479 | 280 | 218 | 328 | 254 | 254 | 736 | 485 | 236 |
| 2016 | 115 | 122 | 543 | 324 | 438 | 491 | 196 | 468 | 472 | 312 | 142 | 194 |
| 2017 | 264 | 208 | 271 | 288 | 370 | 248 | 147 | 237 | 255 | 262 | 365 | 267 |
| 2018 | 269 | 321 | 248 | 258 | 221 | 197 | 101 | 400 | 349 | 194 | 295 | 222 |
| 2019 | 319 | 98 | 444 | 390 | 98 | 144 | 170 | 222 | 272 | 342 | 196 | 380 |
| 2020 | 146 | 130 | 98 | 214 | 220 | 126 | 172 | 75 | 235 | 339 | 88 | 211 |
| 2021 | 151 | 263 | 399 | 228 | 247 | 295 | 178 | 125 | 346 | 288 | 278 | 172 |
| 2022 | 251 | 139 | 254 | 118 | 577 | 223 | 319 | 122 | 288 | 156 | 187 | 219 |
| 2023 | 174 | 261 | 144 | 313 | 488 | 325 | 147 | 24 | 142 | 0 | 334 | 181 |
| 2024 | 0 | |||||||||||
| - = No Data Reported; -- = Not Applicable; NA = Not Available; W = Withheld to avoid disclosure of individual company data. |
| Release Date: 3/29/2024 |
| Next Release Date: 4/30/2024 |