|
Download Data (XLS File) |
|
||||||||
|
||||||||
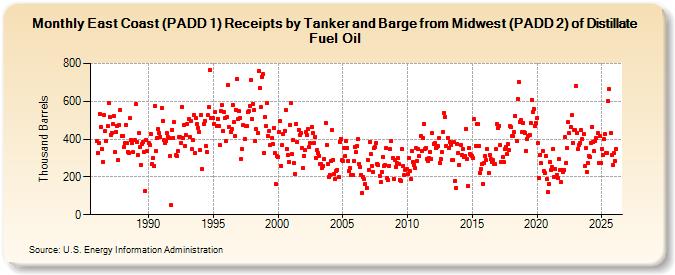
| East Coast (PADD 1) Receipts by Tanker and Barge from Midwest (PADD 2) of Distillate Fuel Oil (Thousand Barrels) | ||||||||
| Year | Jan | Feb | Mar | Apr | May | Jun | Jul | Aug | Sep | Oct | Nov | Dec |
|---|---|---|---|---|---|---|---|---|---|---|---|---|
| 1986 | 390 | 329 | 380 | 531 | 463 | 346 | 279 | 527 | 441 | 389 | 469 | 593 |
| 1987 | 518 | 422 | 434 | 478 | 523 | 334 | 438 | 470 | 290 | 475 | 555 | 417 |
| 1988 | 418 | 359 | 377 | 476 | 380 | 332 | 327 | 509 | 395 | 379 | 330 | 395 |
| 1989 | 584 | 385 | 314 | 431 | 356 | 265 | 373 | 385 | 333 | 125 | 397 | 337 |
| 1990 | 382 | 369 | 425 | 269 | 300 | 257 | 577 | 337 | 407 | 451 | 432 | 412 |
| 1991 | 567 | 496 | 394 | 382 | 392 | 430 | 412 | 407 | 311 | 50 | 450 | 408 |
| 1992 | 489 | 314 | 309 | 336 | 410 | 410 | 378 | 571 | 408 | 477 | 366 | 420 |
| 1993 | 482 | 504 | 411 | 498 | 346 | 394 | 528 | 326 | 509 | 478 | 461 | 437 |
| 1994 | 342 | 528 | 240 | 479 | 496 | 361 | 332 | 526 | 568 | 768 | 509 | 514 |
| 1995 | 510 | 481 | 542 | 469 | 508 | 468 | 369 | 549 | 580 | 441 | 545 | 509 |
| 1996 | 388 | 515 | 684 | 464 | 439 | 451 | 583 | 489 | 415 | 556 | 718 | 504 |
| 1997 | 546 | 513 | 295 | 347 | 475 | 403 | 471 | 467 | 542 | 546 | 575 | 715 |
| 1998 | 506 | 587 | 554 | 391 | 451 | 432 | 759 | 671 | 569 | 730 | 742 | 328 |
| 1999 | 515 | 471 | 590 | 416 | 443 | 371 | 404 | 373 | 461 | 325 | 161 | 311 |
| 2000 | 306 | 437 | 495 | 258 | 367 | 427 | 445 | 554 | 349 | 314 | 280 | 477 |
| 2001 | 591 | 319 | 394 | 273 | 216 | 480 | 383 | 450 | 424 | 433 | 355 | 248 |
| 2002 | 311 | 341 | 439 | 420 | 452 | 356 | 379 | 466 | 432 | 382 | 410 | 299 |
| 2003 | 342 | 327 | 312 | 267 | 270 | 245 | 257 | 296 | 487 | 371 | 267 | 202 |
| 2004 | 212 | 284 | 449 | 292 | 216 | 188 | 229 | 238 | 198 | 386 | 402 | 288 |
| 2005 | 285 | 351 | 308 | 390 | 353 | 283 | 231 | 247 | 209 | 212 | 285 | 359 |
| 2006 | 331 | 364 | 401 | 270 | 253 | 211 | 116 | 201 | 187 | 160 | 143 | 291 |
| 2007 | 237 | 386 | 319 | 260 | 228 | 354 | 358 | 380 | 270 | 262 | 207 | 171 |
| 2008 | 227 | 304 | 257 | 264 | 351 | 194 | 183 | 259 | 347 | 392 | 300 | 191 |
| 2009 | 291 | 252 | 273 | 301 | 268 | 183 | 180 | 347 | 258 | 211 | 237 | 242 |
| 2010 | 214 | 298 | 231 | 188 | 337 | 279 | 264 | 248 | 351 | 284 | 345 | 308 |
| 2011 | 416 | 339 | 405 | 481 | 348 | 354 | 294 | 286 | 298 | 334 | 297 | 433 |
| 2012 | 376 | 378 | 354 | 360 | 362 | 405 | 274 | 293 | 330 | 438 | 540 | 517 |
| 2013 | 365 | 405 | 352 | 386 | 371 | 287 | 289 | 383 | 180 | 142 | 376 | 327 |
| 2014 | 265 | 368 | 316 | 350 | 303 | 310 | 455 | 295 | 154 | 352 | 320 | 315 |
| 2015 | 313 | 298 | 504 | 363 | 479 | 482 | 365 | 223 | 243 | 267 | 164 | 273 |
| 2016 | 311 | 289 | 347 | 221 | 318 | 296 | 278 | 287 | 270 | 267 | 346 | 478 |
| 2017 | 459 | 471 | 368 | 281 | 303 | 278 | 346 | 359 | 319 | 374 | 341 | 467 |
| 2018 | 464 | 416 | 415 | 437 | 522 | 392 | 613 | 702 | 492 | 499 | 435 | 487 |
| 2019 | 438 | 431 | 338 | 402 | 415 | 423 | 486 | 607 | 542 | 559 | 471 | 486 |
| 2020 | 512 | 379 | 192 | 318 | 271 | 339 | 231 | 220 | 313 | 188 | 121 | 162 |
| 2021 | 278 | 234 | 251 | 347 | 201 | 242 | 212 | 193 | 296 | 236 | 172 | 237 |
| 2022 | 228 | 236 | 411 | 276 | 353 | 488 | 430 | 465 | 525 | 382 | 450 | 447 |
| 2023 | 682 | 431 | 347 | 369 | 380 | 447 | 400 | 428 | 256 | 353 | 228 | 273 |
| 2024 | 313 | |||||||||||
| - = No Data Reported; -- = Not Applicable; NA = Not Available; W = Withheld to avoid disclosure of individual company data. |
| Release Date: 3/29/2024 |
| Next Release Date: 4/30/2024 |