|
Download Data (XLS File) |
|
||||||||
|
||||||||
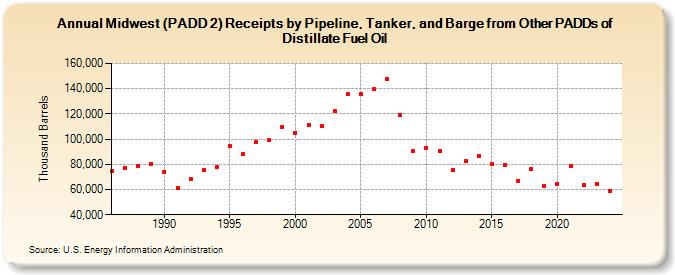
| Midwest (PADD 2) Receipts by Pipeline, Tanker, and Barge from Other PADDs of Distillate Fuel Oil (Thousand Barrels) | ||||||||
| Decade | Year-0 | Year-1 | Year-2 | Year-3 | Year-4 | Year-5 | Year-6 | Year-7 | Year-8 | Year-9 |
|---|---|---|---|---|---|---|---|---|---|---|
| 1980's | 74,407 | 77,190 | 78,868 | 80,221 | ||||||
| 1990's | 74,124 | 61,192 | 68,501 | 75,465 | 78,173 | 94,179 | 87,914 | 98,065 | 99,113 | 109,878 |
| 2000's | 105,001 | 111,143 | 110,425 | 122,179 | 135,777 | 135,555 | 140,053 | 147,526 | 119,124 | 90,415 |
| 2010's | 92,610 | 90,292 | 75,683 | 82,284 | 86,385 | 79,915 | 79,814 | 66,758 | 76,084 | 63,015 |
| 2020's | 64,443 | 78,667 | 63,240 | 64,408 |
| - = No Data Reported; -- = Not Applicable; NA = Not Available; W = Withheld to avoid disclosure of individual company data. |
| Release Date: 3/29/2024 |
| Next Release Date: 8/30/2024 |