|
Download Data (XLS File) |
|
||||||||
|
||||||||
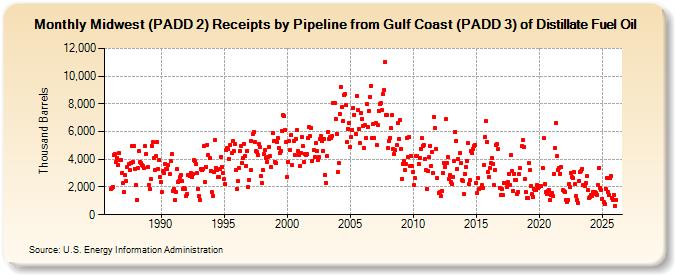
| Midwest (PADD 2) Receipts by Pipeline from Gulf Coast (PADD 3) of Distillate Fuel Oil (Thousand Barrels) | ||||||||
| Year | Jan | Feb | Mar | Apr | May | Jun | Jul | Aug | Sep | Oct | Nov | Dec |
|---|---|---|---|---|---|---|---|---|---|---|---|---|
| 1986 | 1,821 | 1,941 | 2,003 | 4,291 | 4,353 | 3,785 | 4,079 | 3,622 | 4,451 | 3,932 | 3,964 | 3,012 |
| 1987 | 2,320 | 1,640 | 2,834 | 2,409 | 3,444 | 3,649 | 3,254 | 3,740 | 4,940 | 3,772 | 4,982 | 3,301 |
| 1988 | 2,178 | 1,094 | 3,342 | 4,586 | 3,792 | 3,709 | 3,594 | 3,530 | 3,367 | 4,929 | 4,400 | 3,409 |
| 1989 | 2,166 | 1,835 | 2,585 | 4,964 | 5,244 | 4,091 | 3,193 | 4,223 | 5,218 | 3,314 | 3,934 | 2,707 |
| 1990 | 2,338 | 1,649 | 3,122 | 3,005 | 3,694 | 3,276 | 3,309 | 3,583 | 2,908 | 3,853 | 4,397 | 1,700 |
| 1991 | 1,845 | 1,057 | 1,625 | 3,296 | 2,337 | 2,425 | 2,698 | 2,855 | 2,412 | 1,864 | 1,892 | 1,847 |
| 1992 | 1,334 | 1,497 | 2,890 | 2,795 | 3,039 | 2,755 | 2,921 | 3,928 | 3,876 | 3,639 | 3,030 | 1,887 |
| 1993 | 1,331 | 1,095 | 3,278 | 3,255 | 3,263 | 4,974 | 2,331 | 3,469 | 5,060 | 4,317 | 4,068 | 3,187 |
| 1994 | 1,628 | 1,373 | 3,079 | 5,419 | 3,397 | 3,213 | 2,717 | 2,728 | 3,275 | 4,149 | 3,476 | 3,021 |
| 1995 | 2,565 | 2,194 | 4,656 | 4,844 | 4,711 | 3,988 | 5,032 | 4,440 | 5,287 | 4,627 | 5,119 | 3,217 |
| 1996 | 1,828 | 2,411 | 3,374 | 4,608 | 4,961 | 3,751 | 4,083 | 5,138 | 4,249 | 3,535 | 4,605 | 2,010 |
| 1997 | 2,511 | 3,203 | 5,331 | 5,811 | 5,957 | 5,256 | 4,599 | 4,553 | 4,292 | 5,066 | 4,858 | 2,800 |
| 1998 | 2,274 | 3,209 | 4,387 | 4,664 | 4,119 | 3,835 | 4,178 | 4,900 | 4,203 | 3,434 | 5,907 | 5,318 |
| 1999 | 3,817 | 3,762 | 5,271 | 5,519 | 4,844 | 4,485 | 4,561 | 6,064 | 7,167 | 7,104 | 6,139 | 5,227 |
| 2000 | 2,745 | 3,838 | 5,326 | 4,640 | 5,769 | 3,581 | 5,351 | 4,336 | 5,475 | 6,076 | 4,588 | 4,322 |
| 2001 | 3,523 | 4,449 | 5,589 | 4,929 | 3,816 | 4,383 | 4,299 | 4,368 | 5,510 | 6,337 | 5,672 | 6,259 |
| 2002 | 3,898 | 4,634 | 4,163 | 5,173 | 4,586 | 3,920 | 4,157 | 5,462 | 5,659 | 5,306 | 4,626 | 5,493 |
| 2003 | 2,889 | 2,295 | 4,223 | 5,991 | 5,429 | 5,631 | 5,522 | 5,709 | 8,081 | 8,051 | 6,937 | 5,817 |
| 2004 | 3,058 | 3,720 | 7,301 | 9,235 | 7,782 | 6,756 | 8,607 | 8,707 | 7,909 | 5,238 | 6,217 | 6,636 |
| 2005 | 4,915 | 5,622 | 6,131 | 7,732 | 7,225 | 5,847 | 8,598 | 7,544 | 6,215 | 5,197 | 7,318 | 6,929 |
| 2006 | 6,392 | 4,824 | 6,455 | 5,570 | 8,012 | 6,325 | 7,505 | 8,511 | 9,306 | 5,564 | 6,579 | 5,554 |
| 2007 | 6,613 | 5,046 | 6,469 | 7,509 | 8,016 | 8,033 | 7,519 | 8,681 | 8,972 | 11,027 | 7,183 | 7,190 |
| 2008 | 4,842 | 5,353 | 5,569 | 6,250 | 7,174 | 4,718 | 4,397 | 4,639 | 5,008 | 6,594 | 5,456 | 6,820 |
| 2009 | 4,776 | 2,611 | 3,679 | 3,911 | 3,255 | 3,648 | 5,554 | 4,182 | 5,640 | 3,500 | 4,226 | 3,525 |
| 2010 | 3,072 | 2,140 | 2,624 | 4,245 | 4,207 | 3,687 | 4,111 | 4,775 | 5,532 | 4,950 | 5,055 | 4,035 |
| 2011 | 3,219 | 1,870 | 3,187 | 4,140 | 4,979 | 3,522 | 4,493 | 2,985 | 7,061 | 6,247 | 4,729 | 2,617 |
| 2012 | 1,564 | 1,613 | 1,368 | 1,742 | 3,034 | 3,752 | 3,464 | 6,879 | 3,720 | 4,171 | 2,598 | 2,842 |
| 2013 | 2,340 | 2,189 | 2,756 | 3,873 | 5,986 | 5,340 | 3,290 | 4,015 | 4,438 | 3,698 | 2,487 | 2,443 |
| 2014 | 1,501 | 2,972 | 3,433 | 3,897 | 5,174 | 2,180 | 2,481 | 4,584 | 4,444 | 4,706 | 4,975 | 5,045 |
| 2015 | 2,297 | 1,566 | 2,622 | 1,867 | 1,918 | 2,112 | 1,898 | 3,569 | 5,603 | 6,744 | 5,278 | 3,071 |
| 2016 | 2,724 | 3,345 | 3,721 | 4,075 | 3,669 | 2,120 | 3,226 | 5,008 | 5,070 | 4,717 | 1,951 | 1,399 |
| 2017 | 1,861 | 1,427 | 2,321 | 2,294 | 2,259 | 1,999 | 2,339 | 2,955 | 2,162 | 4,308 | 3,158 | 1,737 |
| 2018 | 2,965 | 2,519 | 2,500 | 1,469 | 1,642 | 2,914 | 3,339 | 4,937 | 5,393 | 4,855 | 2,580 | 1,643 |
| 2019 | 1,195 | 1,231 | 3,715 | 3,210 | 2,085 | 1,468 | 1,300 | 1,821 | 1,778 | 1,789 | 2,117 | 1,923 |
| 2020 | 2,021 | 2,060 | 2,039 | 3,383 | 5,507 | 2,223 | 1,632 | 1,472 | 1,739 | 1,789 | 1,092 | 1,392 |
| 2021 | 1,590 | 1,317 | 2,957 | 4,839 | 6,626 | 4,209 | 3,210 | 3,378 | 2,971 | 3,412 | 1,755 | 1,731 |
| 2022 | 1,666 | 1,085 | 901 | 1,079 | 2,205 | 1,998 | 3,045 | 2,699 | 2,636 | 3,074 | 2,204 | 1,319 |
| 2023 | 1,082 | 850 | 2,456 | 3,049 | 3,151 | 3,318 | 2,118 | 2,105 | 2,305 | 2,784 | 1,759 | 1,215 |
| 2024 | 1,254 | |||||||||||
| - = No Data Reported; -- = Not Applicable; NA = Not Available; W = Withheld to avoid disclosure of individual company data. |
| Release Date: 3/29/2024 |
| Next Release Date: 4/30/2024 |