|
Download Data (XLS File) |
|
||||||||
|
||||||||
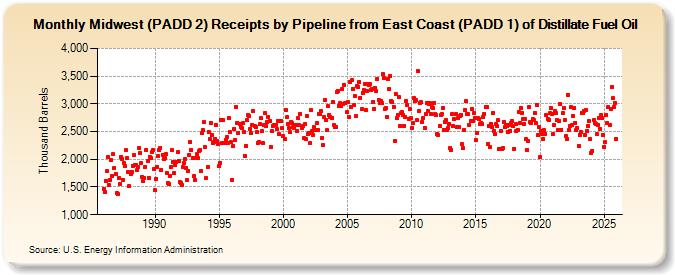
| Midwest (PADD 2) Receipts by Pipeline from East Coast (PADD 1) of Distillate Fuel Oil (Thousand Barrels) | ||||||||
| Year | Jan | Feb | Mar | Apr | May | Jun | Jul | Aug | Sep | Oct | Nov | Dec |
|---|---|---|---|---|---|---|---|---|---|---|---|---|
| 1986 | 1,466 | 1,415 | 1,617 | 1,781 | 2,039 | 1,530 | 1,630 | 1,990 | 1,705 | 2,089 | 1,848 | 1,737 |
| 1987 | 1,391 | 1,367 | 1,658 | 1,546 | 2,045 | 2,009 | 1,628 | 1,932 | 1,879 | 2,162 | 2,024 | 1,769 |
| 1988 | 1,509 | 1,728 | 1,772 | 1,879 | 2,073 | 1,897 | 1,892 | 1,801 | 1,854 | 2,212 | 2,122 | 1,926 |
| 1989 | 1,683 | 1,603 | 1,668 | 1,868 | 2,163 | 1,973 | 1,667 | 2,050 | 2,020 | 2,131 | 2,159 | 1,826 |
| 1990 | 1,438 | 1,649 | 1,867 | 2,056 | 2,165 | 2,209 | 1,812 | 2,081 | 2,005 | 2,024 | 2,093 | 1,753 |
| 1991 | 1,567 | 1,556 | 1,703 | 1,865 | 2,160 | 1,954 | 1,748 | 1,889 | 1,956 | 2,127 | 1,975 | 1,595 |
| 1992 | 1,572 | 1,542 | 1,855 | 1,925 | 2,006 | 1,851 | 1,629 | 1,793 | 2,084 | 2,312 | 2,164 | 2,023 |
| 1993 | 1,691 | 1,630 | 2,018 | 2,089 | 2,017 | 2,142 | 2,169 | 1,795 | 2,471 | 2,520 | 2,665 | 2,221 |
| 1994 | 1,654 | 1,856 | 2,489 | 2,362 | 2,655 | 2,435 | 2,301 | 2,317 | 2,370 | 2,615 | 2,326 | 2,284 |
| 1995 | 1,885 | 1,938 | 2,702 | 2,292 | 2,705 | 2,286 | 2,349 | 2,398 | 2,298 | 2,747 | 2,484 | 2,309 |
| 1996 | 1,630 | 2,237 | 2,554 | 2,345 | 2,949 | 2,661 | 2,472 | 2,638 | 2,585 | 2,565 | 2,647 | 2,493 |
| 1997 | 2,056 | 2,246 | 2,703 | 2,790 | 2,781 | 2,552 | 2,470 | 2,622 | 2,865 | 2,603 | 2,580 | 2,493 |
| 1998 | 2,296 | 2,305 | 2,633 | 2,739 | 2,503 | 2,293 | 2,614 | 2,839 | 2,592 | 2,675 | 2,770 | 2,687 |
| 1999 | 2,224 | 2,509 | 2,599 | 2,618 | 2,622 | 2,618 | 2,539 | 2,690 | 2,452 | 2,686 | 2,687 | 2,567 |
| 2000 | 2,418 | 2,363 | 2,890 | 2,757 | 2,641 | 2,557 | 2,486 | 2,677 | 2,661 | 2,580 | 2,558 | 2,623 |
| 2001 | 2,615 | 2,509 | 2,744 | 2,611 | 2,816 | 2,571 | 2,609 | 2,378 | 2,632 | 2,360 | 2,781 | 2,456 |
| 2002 | 2,472 | 2,295 | 2,888 | 2,503 | 2,436 | 2,576 | 2,524 | 2,646 | 2,524 | 2,820 | 2,822 | 2,864 |
| 2003 | 2,388 | 2,254 | 2,764 | 3,068 | 2,715 | 2,519 | 2,958 | 2,806 | 2,770 | 2,747 | 3,027 | 2,611 |
| 2004 | 2,590 | 2,581 | 3,206 | 3,236 | 2,967 | 3,016 | 2,954 | 3,266 | 3,003 | 3,338 | 3,009 | 2,851 |
| 2005 | 3,038 | 2,755 | 3,398 | 2,943 | 3,427 | 3,273 | 2,972 | 3,141 | 2,774 | 3,318 | 3,310 | 3,401 |
| 2006 | 3,110 | 2,904 | 3,198 | 3,253 | 3,356 | 2,892 | 3,228 | 3,366 | 3,343 | 3,351 | 3,257 | 3,259 |
| 2007 | 3,039 | 2,909 | 3,293 | 3,229 | 3,454 | 3,061 | 3,007 | 3,050 | 3,012 | 3,533 | 3,463 | 2,907 |
| 2008 | 2,923 | 2,771 | 3,444 | 3,264 | 3,498 | 3,050 | 3,034 | 2,949 | 2,330 | 3,182 | 2,736 | 2,796 |
| 2009 | 3,115 | 2,598 | 2,830 | 2,845 | 2,807 | 2,605 | 2,769 | 3,053 | 2,976 | 2,731 | 2,908 | 2,741 |
| 2010 | 2,573 | 2,658 | 3,100 | 3,050 | 3,061 | 2,701 | 3,586 | 2,868 | 3,024 | 3,027 | 2,676 | 2,746 |
| 2011 | 2,572 | 2,816 | 3,016 | 2,868 | 2,996 | 3,011 | 2,823 | 2,946 | 2,928 | 3,020 | 2,811 | 2,790 |
| 2012 | 2,458 | 2,439 | 2,609 | 2,800 | 2,814 | 2,929 | 2,534 | 2,676 | 2,708 | 2,533 | 2,567 | 2,639 |
| 2013 | 2,201 | 2,163 | 2,814 | 2,606 | 2,726 | 2,809 | 2,577 | 2,737 | 2,585 | 2,782 | 2,806 | 2,273 |
| 2014 | 2,195 | 2,532 | 2,892 | 3,044 | 2,808 | 2,815 | 2,617 | 2,692 | 2,902 | 2,686 | 2,835 | 2,752 |
| 2015 | 2,341 | 2,481 | 2,741 | 2,721 | 2,630 | 2,650 | 2,637 | 2,759 | 2,825 | 2,937 | 2,942 | 2,273 |
| 2016 | 2,607 | 2,216 | 2,644 | 2,582 | 2,837 | 2,507 | 2,459 | 2,632 | 2,592 | 2,707 | 2,182 | 2,503 |
| 2017 | 2,194 | 2,197 | 2,681 | 2,580 | 2,624 | 2,592 | 2,492 | 2,623 | 2,507 | 2,653 | 2,685 | 2,596 |
| 2018 | 2,192 | 2,637 | 2,503 | 2,534 | 2,861 | 2,662 | 2,922 | 2,842 | 2,727 | 2,628 | 2,722 | 2,359 |
| 2019 | 2,174 | 2,335 | 2,944 | 2,670 | 2,661 | 2,722 | 2,701 | 2,840 | 2,654 | 2,982 | 2,442 | 2,583 |
| 2020 | 2,038 | 2,516 | 2,449 | 2,364 | 2,523 | 2,460 | 2,796 | 2,735 | 2,716 | 2,826 | 2,925 | 2,809 |
| 2021 | 2,454 | 2,624 | 2,863 | 2,827 | 2,706 | 2,526 | 2,697 | 2,990 | 2,533 | 2,835 | 2,929 | 2,707 |
| 2022 | 2,427 | 2,371 | 3,167 | 2,532 | 2,599 | 2,934 | 2,619 | 2,786 | 2,930 | 2,661 | 2,534 | 2,564 |
| 2023 | 2,244 | 2,445 | 2,487 | 2,835 | 2,840 | 2,864 | 2,440 | 2,889 | 2,518 | 2,596 | 2,685 | 2,357 |
| 2024 | 2,118 | |||||||||||
| - = No Data Reported; -- = Not Applicable; NA = Not Available; W = Withheld to avoid disclosure of individual company data. |
| Release Date: 3/29/2024 |
| Next Release Date: 4/30/2024 |