|
Download Data (XLS File) |
|
||||||||
|
||||||||
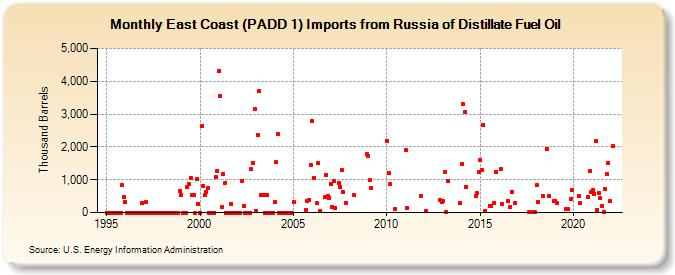
| East Coast (PADD 1) Imports from Russia of Distillate Fuel Oil (Thousand Barrels) | ||||||||
| Year | Jan | Feb | Mar | Apr | May | Jun | Jul | Aug | Sep | Oct | Nov | Dec |
|---|---|---|---|---|---|---|---|---|---|---|---|---|
| 1995 | 0 | 0 | 0 | 0 | 0 | 0 | 0 | 0 | 0 | 0 | 831 | 469 |
| 1996 | 326 | 0 | 0 | 0 | 0 | 0 | 0 | 0 | 0 | 0 | 0 | 298 |
| 1997 | 0 | 330 | 0 | 0 | 0 | 0 | 0 | 0 | 0 | 0 | 0 | 0 |
| 1998 | 0 | 0 | 0 | 0 | 0 | 0 | 0 | 0 | 0 | 0 | 0 | 650 |
| 1999 | 536 | 0 | 0 | 0 | 773 | 858 | 1,054 | 533 | 526 | 0 | 1,032 | 256 |
| 2000 | 0 | 2,622 | 813 | 528 | 634 | 737 | 0 | 0 | 0 | 0 | 1,068 | 1,277 |
| 2001 | 4,325 | 3,546 | 156 | 1,169 | 890 | 0 | 0 | 0 | 259 | 0 | 0 | 0 |
| 2002 | 0 | 0 | 0 | 973 | 201 | 0 | 0 | 0 | 0 | 1,314 | 1,515 | 3,143 |
| 2003 | 55 | 2,368 | 3,711 | 545 | 527 | 526 | 0 | 550 | 0 | 0 | 0 | 0 |
| 2004 | 329 | 1,531 | 2,395 | 0 | 0 | 0 | 0 | 0 | 0 | 0 | 0 | 0 |
| 2005 | 324 | 92 | 352 | 388 | 1,460 | |||||||
| 2006 | 2,778 | 1,045 | 279 | 1,497 | 38 | 461 | 1,144 | 509 | 449 | |||
| 2007 | 859 | 166 | 962 | 154 | 894 | 768 | 1,304 | 633 | 302 | |||
| 2008 | 527 | 1,781 | ||||||||||
| 2009 | 1,720 | 982 | 747 | |||||||||
| 2010 | 2,172 | 1,212 | 860 | 100 | ||||||||
| 2011 | 1,907 | 149 | 495 | |||||||||
| 2012 | 33 | 368 | 314 | |||||||||
| 2013 | 344 | 1,222 | 32 | 973 | 292 | |||||||
| 2014 | 1,494 | 3,298 | 3,064 | 779 | 500 | 590 | 1,233 | |||||
| 2015 | 1,587 | 1,310 | 2,667 | 40 | 214 | 215 | 301 | 1,243 | ||||
| 2016 | 1,328 | 263 | 344 | 172 | 632 | 296 | ||||||
| 2017 | 24 | 7 | 6 | |||||||||
| 2018 | 839 | 319 | 506 | 1,921 | 492 | 345 | ||||||
| 2019 | 364 | 278 | 110 | 95 | 425 | 680 | ||||||
| 2020 | 499 | 285 | 478 | 1,267 | 614 | |||||||
| 2021 | 679 | 577 | 2,181 | 88 | 581 | 454 | 194 | 23 | 720 | 1,184 | 1,505 | 337 |
| 2022 | 2,021 | |||||||||||
| - = No Data Reported; -- = Not Applicable; NA = Not Available; W = Withheld to avoid disclosure of individual company data. |
| Release Date: 3/29/2024 |
| Next Release Date: 4/30/2024 |