|
Download Data (XLS File) |
|
||||||||
|
||||||||
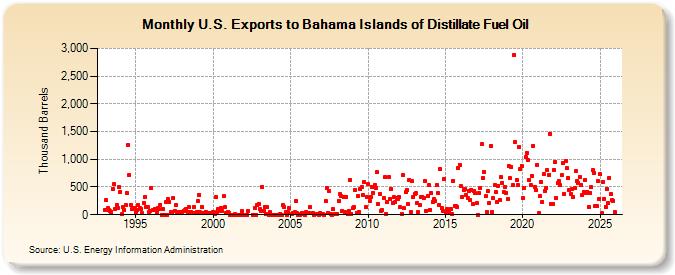
| U.S. Exports to Bahama Islands of Distillate Fuel Oil (Thousand Barrels) | ||||||||
| Year | Jan | Feb | Mar | Apr | May | Jun | Jul | Aug | Sep | Oct | Nov | Dec |
|---|---|---|---|---|---|---|---|---|---|---|---|---|
| 1993 | 94 | 258 | 114 | 83 | 60 | 51 | 471 | 551 | 95 | 177 | 113 | 493 |
| 1994 | 416 | 6 | 131 | 88 | 167 | 394 | 1,256 | 716 | 180 | 100 | 130 | 124 |
| 1995 | 56 | 79 | 178 | 120 | 111 | 22 | 220 | 316 | 146 | 142 | 50 | 61 |
| 1996 | 484 | 86 | 79 | 112 | 42 | 121 | 95 | 184 | 2 | 100 | 1 | 229 |
| 1997 | 2 | 275 | 233 | 52 | 50 | 298 | 68 | 169 | 50 | 41 | 34 | 41 |
| 1998 | 54 | 74 | 79 | 107 | 48 | 141 | 40 | 40 | 28 | 139 | 28 | 50 |
| 1999 | 246 | 360 | 44 | 148 | 38 | 38 | 52 | 26 | 33 | 38 | 27 | 37 |
| 2000 | 49 | 20 | 323 | 49 | 101 | 76 | 126 | 70 | 332 | 131 | 39 | 48 |
| 2001 | 32 | 1 | 0 | 0 | 0 | 8 | 0 | 0 | 0 | 0 | 60 | 0 |
| 2002 | 0 | 1 | 1 | 60 | 1 | 116 | 1 | 168 | 194 | |||
| 2003 | 106 | 72 | 503 | 66 | 147 | 16 | 131 | 2 | 43 | 0 | 1 | |
| 2004 | 1 | 1 | 1 | 1 | 18 | 2 | 168 | 138 | 45 | 1 | 41 | 115 |
| 2005 | 10 | 33 | 40 | 255 | 25 | 0 | 1 | 19 | 38 | 20 | 1 | |
| 2006 | 40 | 30 | 26 | 138 | 27 | 0 | 19 | 19 | 10 | 0 | 29 | |
| 2007 | 11 | 12 | 0 | 247 | 482 | 37 | 419 | 20 | 1 | 95 | 17 | 16 |
| 2008 | 19 | 255 | 369 | 338 | 66 | 318 | 56 | 322 | 12 | 66 | 630 | 20 |
| 2009 | 122 | 135 | 450 | 33 | 330 | 46 | 460 | 496 | 352 | 594 | 136 | 324 |
| 2010 | 551 | 248 | 324 | 499 | 392 | 532 | 490 | 764 | 199 | 376 | 66 | 83 |
| 2011 | 297 | 675 | 21 | 225 | 687 | 291 | 460 | 219 | 313 | 229 | 304 | 287 |
| 2012 | 321 | 134 | 21 | 709 | 114 | 404 | 444 | 188 | 631 | 47 | 600 | 311 |
| 2013 | 377 | 384 | 220 | 44 | 169 | 319 | 327 | 296 | 604 | 76 | 334 | 534 |
| 2014 | 87 | 383 | 232 | 277 | 242 | 529 | 391 | 172 | 824 | 114 | 65 | 651 |
| 2015 | 33 | 111 | 67 | 44 | 112 | 21 | 615 | 158 | 157 | 135 | 850 | 899 |
| 2016 | 521 | 315 | 446 | 469 | 356 | 303 | 436 | 272 | 450 | 196 | 431 | 388 |
| 2017 | 205 | 1 | 396 | 484 | 1,269 | 660 | 775 | 329 | 40 | 421 | 215 | 1,247 |
| 2018 | 46 | 295 | 532 | 414 | 229 | 520 | 261 | 672 | 577 | 405 | 508 | 393 |
| 2019 | 283 | 883 | 656 | 861 | 538 | 2,879 | 1,307 | 633 | 529 | 1,223 | 826 | 881 |
| 2020 | 296 | 490 | 1,037 | 1,118 | 980 | 620 | 533 | 701 | 1,246 | 506 | 438 | 898 |
| 2021 | 25 | 335 | 599 | 238 | 728 | 425 | 487 | 798 | 719 | 1,461 | 186 | 202 |
| 2022 | 814 | 950 | 299 | 578 | 603 | 527 | 709 | 933 | 378 | 965 | 843 | 662 |
| 2023 | 368 | 382 | 768 | 546 | 453 | 762 | 585 | 827 | 661 | 539 | 352 | 412 |
| 2024 | 603 | |||||||||||
| - = No Data Reported; -- = Not Applicable; NA = Not Available; W = Withheld to avoid disclosure of individual company data. |
| Release Date: 3/29/2024 |
| Next Release Date: 4/30/2024 |