|
Download Data (XLS File) |
|
||||||||
|
||||||||
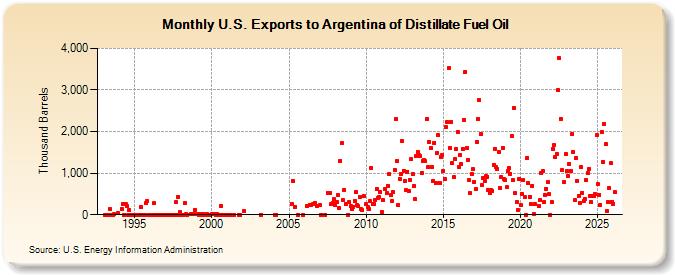
| U.S. Exports to Argentina of Distillate Fuel Oil (Thousand Barrels) | ||||||||
| Year | Jan | Feb | Mar | Apr | May | Jun | Jul | Aug | Sep | Oct | Nov | Dec |
|---|---|---|---|---|---|---|---|---|---|---|---|---|
| 1993 | 0 | 0 | 0 | 142 | 0 | 10 | 37 | |||||
| 1994 | 140 | 269 | 0 | 248 | 198 | 0 | 115 | 0 | 2 | 1 | ||
| 1995 | 1 | 0 | 1 | 1 | 0 | 184 | 1 | 0 | 2 | 290 | 323 | 2 |
| 1996 | 1 | 3 | 3 | 274 | 2 | 3 | 1 | 4 | 0 | 0 | 0 | |
| 1997 | 0 | 0 | 3 | 1 | 1 | 0 | 305 | 2 | 434 | 56 | ||
| 1998 | 1 | 4 | 1 | 277 | 20 | 1 | 16 | 15 | 114 | |||
| 1999 | 16 | 0 | 17 | 1 | 15 | 1 | 15 | 2 | 5 | 0 | ||
| 2000 | 14 | 17 | 1 | 16 | 2 | 215 | 1 | 0 | 1 | |||
| 2001 | 0 | 1 | 1 | 4 | 0 | |||||||
| 2002 | 86 | |||||||||||
| 2003 | 0 | |||||||||||
| 2004 | 0 | 0 | ||||||||||
| 2005 | 265 | 813 | 197 | 0 | 1 | |||||||
| 2006 | 207 | 240 | 242 | 257 | 293 | 214 | ||||||
| 2007 | 231 | 0 | 0 | 532 | 517 | 269 | 276 | 366 | ||||
| 2008 | 228 | 302 | 485 | 150 | 1,298 | 1,724 | 348 | 597 | 258 | 0 | 305 | |
| 2009 | 205 | 130 | 194 | 336 | 541 | 238 | 199 | 437 | 126 | 110 | 458 | |
| 2010 | 249 | 180 | 128 | 319 | 1,131 | 255 | 265 | 363 | 626 | 408 | 430 | 537 |
| 2011 | 77 | 343 | 630 | 511 | 696 | 984 | 463 | 328 | 541 | 1,083 | 2,301 | |
| 2012 | 1,294 | 230 | 864 | 980 | 1,776 | 1,059 | 822 | 585 | 1,038 | 579 | 844 | 1,328 |
| 2013 | 980 | 700 | 371 | 1,415 | 1,520 | 1,448 | 1,406 | 1,015 | 1,303 | 1,322 | 1,283 | 2,303 |
| 2014 | 1,150 | 1,756 | 1,599 | 1,151 | 812 | 1,725 | 758 | 1,480 | 1,912 | 772 | 1,392 | 1,425 |
| 2015 | 1,054 | 857 | 2,114 | 2,241 | 3,524 | 1,612 | 2,234 | 1,236 | 900 | 1,344 | 1,580 | 1,989 |
| 2016 | 1,153 | 1,435 | 1,225 | 1,586 | 2,286 | 3,439 | 1,606 | 1,322 | 828 | 517 | 986 | 1,092 |
| 2017 | 792 | 619 | 1,754 | 2,310 | 2,758 | 1,941 | 711 | 873 | 816 | 920 | 919 | 589 |
| 2018 | 523 | 590 | 577 | 1,207 | 1,584 | 1,139 | 1,104 | 1,513 | 636 | 901 | 1,611 | 864 |
| 2019 | 830 | 666 | 1,040 | 1,121 | 991 | 1,899 | 833 | 2,573 | 522 | 308 | 110 | 870 |
| 2020 | 224 | 503 | 834 | 434 | 0 | 1,374 | 756 | 436 | 250 | 702 | 28 | 251 |
| 2021 | 220 | 359 | 1,000 | 1,046 | 307 | 486 | 628 | 780 | 490 | 0 | ||
| 2022 | 314 | 1,572 | 1,670 | 1,378 | 1,462 | 2,997 | 3,764 | 2,311 | 1,066 | 778 | 1,462 | |
| 2023 | 1,347 | 920 | 1,231 | 1,342 | 1,643 | 1,798 | 60 | 1,371 | 806 | 454 | 291 | 1,360 |
| 2024 | 530 | |||||||||||
| - = No Data Reported; -- = Not Applicable; NA = Not Available; W = Withheld to avoid disclosure of individual company data. |
| Release Date: 3/29/2024 |
| Next Release Date: 4/30/2024 |