|
Download Data (XLS File) |
|
||||||||
|
||||||||
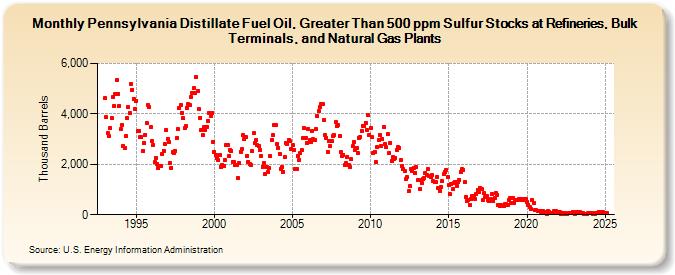
| Pennsylvania Distillate Fuel Oil, Greater Than 500 ppm Sulfur Stocks at Refineries, Bulk Terminals, and Natural Gas Plants (Thousand Barrels) | ||||||||
| Year | Jan | Feb | Mar | Apr | May | Jun | Jul | Aug | Sep | Oct | Nov | Dec |
|---|---|---|---|---|---|---|---|---|---|---|---|---|
| 1993 | 4,613 | 3,857 | 3,229 | 3,117 | 3,442 | 3,839 | 4,679 | 4,305 | 4,784 | 5,329 | 4,809 | 4,325 |
| 1994 | 3,388 | 3,567 | 2,707 | 2,642 | 3,111 | 3,830 | 4,260 | 4,029 | 5,203 | 4,958 | 4,606 | 4,212 |
| 1995 | 4,520 | 3,307 | 3,336 | 3,082 | 3,073 | 2,524 | 2,838 | 3,174 | 3,641 | 4,359 | 4,264 | 3,467 |
| 1996 | 2,914 | 2,775 | 2,081 | 2,243 | 2,023 | 1,840 | 1,917 | 1,942 | 2,418 | 2,535 | 2,796 | 3,364 |
| 1997 | 3,023 | 2,886 | 2,044 | 1,869 | 2,483 | 2,445 | 2,544 | 3,050 | 3,382 | 4,239 | 4,352 | 4,050 |
| 1998 | 3,819 | 3,424 | 3,516 | 4,244 | 4,407 | 4,352 | 4,675 | 4,843 | 5,023 | 4,836 | 5,457 | 4,904 |
| 1999 | 4,183 | 3,854 | 3,344 | 3,143 | 3,465 | 3,368 | 3,495 | 3,736 | 4,035 | 3,907 | 4,032 | 2,893 |
| 2000 | 2,489 | 2,388 | 2,236 | 2,170 | 2,357 | 1,898 | 1,990 | 1,919 | 2,177 | 2,777 | 2,765 | 2,326 |
| 2001 | 2,574 | 2,537 | 2,101 | 2,085 | 1,984 | 1,965 | 1,455 | 2,052 | 2,489 | 2,594 | 3,145 | 3,011 |
| 2002 | 3,073 | 2,340 | 2,103 | 2,008 | 1,968 | 2,510 | 3,226 | 2,829 | 2,956 | 2,753 | 2,726 | 2,570 |
| 2003 | 2,345 | 1,908 | 2,054 | 1,632 | 1,894 | 1,677 | 1,853 | 2,317 | 2,956 | 3,148 | 3,543 | 3,552 |
| 2004 | 2,807 | 2,662 | 2,417 | 1,816 | 1,889 | 1,711 | 2,276 | 2,861 | 2,795 | 2,979 | 2,910 | 2,598 |
| 2005 | 2,754 | 2,577 | 1,808 | 1,827 | 2,349 | 2,180 | 2,440 | 2,563 | 3,030 | 3,448 | 3,063 | 2,848 |
| 2006 | 3,405 | 2,946 | 2,875 | 3,326 | 2,991 | 2,949 | 3,388 | 3,903 | 4,109 | 4,281 | 4,406 | 4,392 |
| 2007 | 3,775 | 3,143 | 3,047 | 2,503 | 2,910 | 2,714 | 2,936 | 3,140 | 3,148 | 3,666 | 3,513 | 3,559 |
| 2008 | 3,132 | 2,507 | 2,344 | 2,385 | 1,972 | 2,040 | 2,297 | 1,962 | 1,883 | 2,193 | 2,712 | 2,876 |
| 2009 | 2,548 | 2,659 | 2,434 | 3,048 | 3,093 | 3,339 | 3,526 | 3,510 | 3,653 | 3,363 | 3,942 | 3,180 |
| 2010 | 3,457 | 3,070 | 2,429 | 2,499 | 2,093 | 2,675 | 2,982 | 3,164 | 2,719 | 3,004 | 3,483 | 2,821 |
| 2011 | 2,682 | 3,186 | 2,456 | 2,852 | 2,124 | 2,295 | 2,213 | 2,253 | 2,585 | 2,675 | 2,647 | 2,166 |
| 2012 | 1,933 | 1,810 | 1,743 | 1,400 | 1,478 | 929 | 1,122 | 1,808 | 1,722 | 1,856 | 1,648 | 1,888 |
| 2013 | 1,376 | 1,367 | 1,026 | 1,241 | 1,423 | 1,476 | 1,653 | 1,568 | 1,796 | 1,521 | 1,485 | 1,556 |
| 2014 | 1,326 | 1,317 | 1,296 | 1,512 | 1,042 | 945 | 1,101 | 1,329 | 1,611 | 1,703 | 1,784 | 1,504 |
| 2015 | 1,179 | 809 | 1,220 | 1,011 | 1,258 | 1,316 | 1,142 | 1,281 | 1,397 | 1,692 | 1,796 | 1,791 |
| 2016 | 1,301 | 711 | 559 | 568 | 390 | 642 | 727 | 757 | 638 | 840 | 990 | 911 |
| 2017 | 1,073 | 1,013 | 566 | 846 | 686 | 754 | 593 | 537 | 614 | 815 | 528 | 649 |
| 2018 | 872 | 797 | 396 | 364 | 379 | 349 | 346 | 413 | 422 | 400 | 598 | 660 |
| 2019 | 466 | 662 | 482 | 579 | 580 | 603 | 611 | 639 | 593 | 594 | 620 | 638 |
| 2020 | 521 | 396 | 314 | 233 | 577 | 457 | 171 | 168 | 134 | 144 | 160 | 122 |
| 2021 | 146 | 110 | 86 | 46 | 131 | 116 | 79 | 52 | 56 | 133 | 149 | 122 |
| 2022 | 108 | 95 | 37 | 62 | 47 | 85 | 39 | 47 | 86 | 68 | 72 | 122 |
| 2023 | 62 | 63 | 132 | 128 | 139 | 104 | 56 | 61 | 44 | 40 | 28 | 75 |
| 2024 | 69 | |||||||||||
| - = No Data Reported; -- = Not Applicable; NA = Not Available; W = Withheld to avoid disclosure of individual company data. |
| Release Date: 3/29/2024 |
| Next Release Date: 4/30/2024 |