|
Download Data (XLS File) |
|
||||||||
|
||||||||
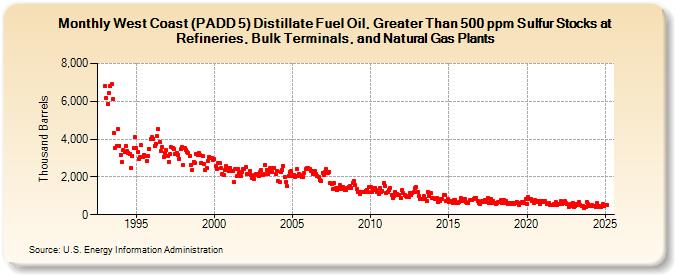
| West Coast (PADD 5) Distillate Fuel Oil, Greater Than 500 ppm Sulfur Stocks at Refineries, Bulk Terminals, and Natural Gas Plants (Thousand Barrels) | ||||||||
| Year | Jan | Feb | Mar | Apr | May | Jun | Jul | Aug | Sep | Oct | Nov | Dec |
|---|---|---|---|---|---|---|---|---|---|---|---|---|
| 1993 | 6,803 | 6,187 | 5,841 | 6,438 | 6,798 | 6,891 | 6,119 | 4,346 | 3,543 | 3,642 | 4,510 | 3,655 |
| 1994 | 3,180 | 2,813 | 3,423 | 3,316 | 3,660 | 3,370 | 3,270 | 3,219 | 2,492 | 3,098 | 3,546 | 4,112 |
| 1995 | 3,533 | 3,310 | 2,957 | 3,069 | 3,671 | 3,056 | 3,175 | 3,097 | 2,825 | 3,109 | 3,495 | 3,985 |
| 1996 | 4,085 | 4,019 | 3,652 | 3,757 | 4,152 | 4,527 | 3,847 | 3,367 | 3,567 | 3,053 | 3,291 | 3,398 |
| 1997 | 3,088 | 2,804 | 3,201 | 3,566 | 3,535 | 3,453 | 3,196 | 3,272 | 3,183 | 2,963 | 3,454 | 3,580 |
| 1998 | 2,627 | 3,545 | 3,427 | 3,328 | 3,262 | 3,127 | 2,646 | 2,369 | 2,810 | 2,756 | 3,206 | 3,140 |
| 1999 | 3,278 | 3,138 | 2,761 | 3,095 | 2,692 | 2,353 | 2,463 | 2,859 | 3,075 | 2,999 | 2,990 | 2,875 |
| 2000 | 2,929 | 2,562 | 2,436 | 2,710 | 2,739 | 2,455 | 2,162 | 2,109 | 2,347 | 2,563 | 2,472 | 2,306 |
| 2001 | 2,493 | 2,302 | 2,288 | 1,740 | 2,393 | 2,043 | 2,409 | 2,208 | 2,038 | 2,282 | 2,412 | 2,420 |
| 2002 | 2,534 | 2,180 | 2,174 | 2,292 | 2,076 | 1,939 | 1,896 | 2,096 | 2,140 | 2,153 | 2,067 | 2,282 |
| 2003 | 2,344 | 2,084 | 2,134 | 2,655 | 2,362 | 2,161 | 2,297 | 2,452 | 2,250 | 2,460 | 2,497 | 2,130 |
| 2004 | 2,330 | 1,775 | 1,728 | 2,285 | 2,370 | 2,569 | 1,988 | 1,737 | 1,501 | 2,049 | 2,270 | 2,297 |
| 2005 | 2,049 | 2,123 | 1,973 | 2,410 | 2,068 | 2,152 | 2,088 | 2,008 | 2,005 | 2,181 | 2,421 | 2,445 |
| 2006 | 2,497 | 2,433 | 2,307 | 2,289 | 2,170 | 2,319 | 2,148 | 2,035 | 2,005 | 1,848 | 1,777 | 2,212 |
| 2007 | 2,099 | 2,240 | 2,415 | 2,233 | 2,262 | 1,667 | 1,611 | 1,334 | 1,682 | 1,389 | 1,283 | 1,425 |
| 2008 | 1,578 | 1,386 | 1,470 | 1,473 | 1,296 | 1,315 | 1,415 | 1,485 | 1,526 | 1,433 | 1,684 | 1,783 |
| 2009 | 1,560 | 1,336 | 1,221 | 1,211 | 1,086 | 1,220 | 1,221 | 1,202 | 1,269 | 1,296 | 1,186 | 1,472 |
| 2010 | 1,444 | 1,187 | 1,317 | 1,431 | 1,282 | 1,214 | 1,073 | 1,418 | 1,227 | 1,266 | 1,702 | 1,520 |
| 2011 | 1,152 | 1,221 | 1,304 | 1,414 | 1,049 | 887 | 976 | 1,219 | 1,122 | 1,030 | 1,063 | 860 |
| 2012 | 1,306 | 1,130 | 1,018 | 1,003 | 959 | 915 | 1,159 | 1,030 | 1,173 | 1,184 | 1,426 | 1,442 |
| 2013 | 1,226 | 992 | 839 | 805 | 810 | 967 | 839 | 701 | 1,219 | 979 | 1,136 | 881 |
| 2014 | 865 | 842 | 812 | 908 | 663 | 742 | 839 | 828 | 1,037 | 1,025 | 750 | 837 |
| 2015 | 662 | 727 | 684 | 619 | 753 | 782 | 608 | 608 | 656 | 882 | 735 | 731 |
| 2016 | 842 | 659 | 594 | 598 | 804 | 804 | 780 | 854 | 910 | 902 | 736 | 615 |
| 2017 | 579 | 714 | 657 | 689 | 780 | 659 | 867 | 601 | 812 | 619 | 715 | 608 |
| 2018 | 561 | 614 | 696 | 658 | 760 | 630 | 769 | 608 | 723 | 549 | 603 | 590 |
| 2019 | 594 | 640 | 593 | 601 | 691 | 641 | 509 | 630 | 665 | 692 | 636 | 834 |
| 2020 | 561 | 915 | 837 | 837 | 720 | 628 | 764 | 660 | 738 | 681 | 578 | 719 |
| 2021 | 691 | 719 | 720 | 562 | 576 | 598 | 526 | 540 | 510 | 588 | 649 | 513 |
| 2022 | 573 | 569 | 703 | 576 | 606 | 704 | 611 | 543 | 412 | 474 | 592 | 626 |
| 2023 | 454 | 556 | 654 | 584 | 674 | 591 | 470 | 462 | 360 | 415 | 670 | 550 |
| 2024 | 483 | |||||||||||
| - = No Data Reported; -- = Not Applicable; NA = Not Available; W = Withheld to avoid disclosure of individual company data. |
| Release Date: 3/29/2024 |
| Next Release Date: 4/30/2024 |