|
Download Data (XLS File) |
|
||||||||
|
||||||||
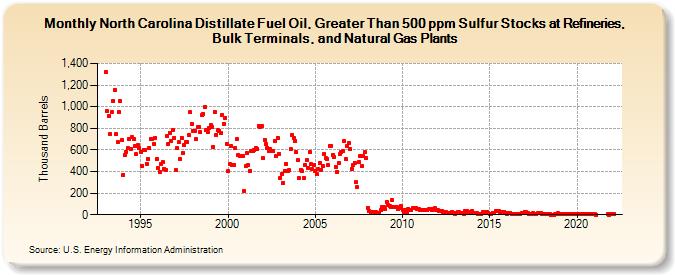
| North Carolina Distillate Fuel Oil, Greater Than 500 ppm Sulfur Stocks at Refineries, Bulk Terminals, and Natural Gas Plants (Thousand Barrels) | ||||||||
| Year | Jan | Feb | Mar | Apr | May | Jun | Jul | Aug | Sep | Oct | Nov | Dec |
|---|---|---|---|---|---|---|---|---|---|---|---|---|
| 1993 | 1,323 | 956 | 914 | 750 | 952 | 1,053 | 1,157 | 743 | 670 | 948 | 1,049 | 690 |
| 1994 | 369 | 552 | 585 | 614 | 705 | 609 | 717 | 697 | 632 | 559 | 643 | 614 |
| 1995 | 583 | 454 | 600 | 600 | 474 | 516 | 619 | 698 | 697 | 656 | 714 | 514 |
| 1996 | 431 | 400 | 474 | 487 | 424 | 414 | 727 | 656 | 755 | 681 | 786 | 714 |
| 1997 | 413 | 613 | 673 | 515 | 713 | 574 | 646 | 673 | 671 | 735 | 947 | 842 |
| 1998 | 773 | 775 | 700 | 808 | 815 | 763 | 919 | 933 | 999 | 780 | 766 | 807 |
| 1999 | 829 | 810 | 628 | 953 | 741 | 780 | 776 | 758 | 921 | 841 | 898 | 656 |
| 2000 | 402 | 467 | 635 | 457 | 458 | 619 | 699 | 554 | 543 | 548 | 547 | 215 |
| 2001 | 448 | 569 | 462 | 403 | 593 | 590 | 599 | 619 | 609 | 824 | 808 | 825 |
| 2002 | 524 | 695 | 654 | 621 | 588 | 607 | 589 | 589 | 685 | 543 | 713 | 566 |
| 2003 | 343 | 378 | 297 | 405 | 470 | 407 | 411 | 606 | 740 | 712 | 686 | 576 |
| 2004 | 502 | 336 | 418 | 403 | 343 | 463 | 502 | 433 | 585 | 466 | 422 | 462 |
| 2005 | 403 | 373 | 424 | 478 | 417 | 453 | 559 | 526 | 514 | 456 | 640 | 637 |
| 2006 | 557 | 534 | 440 | 397 | 479 | 562 | 585 | 586 | 682 | 517 | 633 | 666 |
| 2007 | 604 | 427 | 457 | 483 | 300 | 253 | 487 | 547 | 449 | 544 | 578 | 523 |
| 2008 | 63 | 34 | 20 | 22 | 24 | 23 | 25 | 12 | 15 | 46 | 67 | 68 |
| 2009 | 53 | 116 | 94 | 82 | 76 | 133 | 76 | 75 | 67 | 56 | 58 | 79 |
| 2010 | 42 | 13 | 43 | 21 | 57 | 48 | 48 | 60 | 66 | 59 | 55 | 53 |
| 2011 | 44 | 46 | 40 | 40 | 47 | 44 | 49 | 49 | 47 | 50 | 61 | 45 |
| 2012 | 40 | 37 | 35 | 30 | 26 | 25 | 23 | 19 | 16 | 12 | 28 | 17 |
| 2013 | 9 | 13 | 26 | 22 | 16 | 14 | 10 | 39 | 34 | 22 | 26 | 17 |
| 2014 | 36 | 20 | 12 | 14 | 11 | 8 | 4 | 25 | 22 | 16 | 29 | 15 |
| 2015 | 3 | 5 | 19 | 16 | 38 | 35 | 31 | 27 | 22 | 16 | 24 | 18 |
| 2016 | 8 | 19 | 16 | 11 | 9 | 5 | 8 | 8 | 4 | 6 | 18 | 17 |
| 2017 | 28 | 21 | 14 | 11 | 7 | 5 | 12 | 9 | 7 | 14 | 13 | 19 |
| 2018 | 6 | 11 | 5 | 6 | 5 | 4 | 1 | 1 | 1 | 9 | 5 | 13 |
| 2019 | 7 | 3 | 4 | 3 | 2 | 6 | 4 | 3 | 2 | 8 | 4 | 9 |
| 2020 | 3 | 3 | 5 | 2 | 5 | 5 | 4 | 8 | 7 | 5 | 8 | 4 |
| 2021 | 3 | 1 | 3 | 1 | 4 | |||||||
| 2022 | 6 | 2 | ||||||||||
| - = No Data Reported; -- = Not Applicable; NA = Not Available; W = Withheld to avoid disclosure of individual company data. |
| Release Date: 3/29/2024 |
| Next Release Date: 4/30/2024 |