|
Download Data (XLS File) |
|
||||||||
|
||||||||
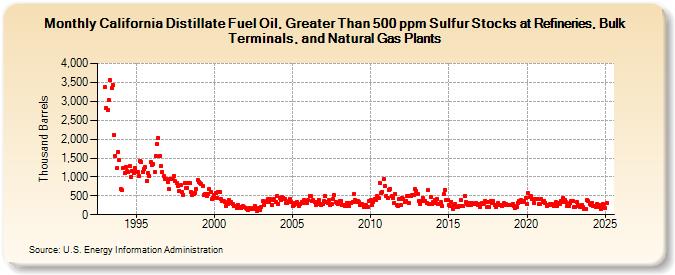
| California Distillate Fuel Oil, Greater Than 500 ppm Sulfur Stocks at Refineries, Bulk Terminals, and Natural Gas Plants (Thousand Barrels) | ||||||||
| Year | Jan | Feb | Mar | Apr | May | Jun | Jul | Aug | Sep | Oct | Nov | Dec |
|---|---|---|---|---|---|---|---|---|---|---|---|---|
| 1993 | 3,377 | 2,833 | 2,767 | 3,035 | 3,554 | 3,351 | 3,440 | 2,115 | 1,556 | 1,235 | 1,663 | 1,445 |
| 1994 | 673 | 644 | 1,239 | 1,100 | 1,263 | 1,145 | 1,128 | 1,288 | 995 | 1,168 | 1,097 | 1,233 |
| 1995 | 1,123 | 1,122 | 1,019 | 1,427 | 1,395 | 1,139 | 1,210 | 1,250 | 902 | 1,095 | 1,027 | 1,390 |
| 1996 | 1,305 | 1,335 | 1,135 | 1,542 | 1,865 | 2,035 | 1,558 | 1,282 | 1,128 | 1,016 | 933 | 956 |
| 1997 | 873 | 668 | 956 | 948 | 957 | 1,037 | 880 | 837 | 748 | 638 | 779 | 598 |
| 1998 | 532 | 847 | 709 | 719 | 829 | 829 | 600 | 529 | 551 | 581 | 671 | 915 |
| 1999 | 872 | 828 | 810 | 749 | 513 | 560 | 506 | 543 | 680 | 614 | 406 | 450 |
| 2000 | 514 | 580 | 454 | 589 | 601 | 427 | 374 | 352 | 343 | 232 | 275 | 397 |
| 2001 | 316 | 336 | 283 | 231 | 224 | 178 | 266 | 211 | 182 | 209 | 221 | 194 |
| 2002 | 179 | 155 | 124 | 179 | 146 | 148 | 190 | 242 | 152 | 106 | 176 | 126 |
| 2003 | 211 | 351 | 259 | 336 | 360 | 404 | 332 | 415 | 269 | 396 | 408 | 341 |
| 2004 | 489 | 295 | 450 | 390 | 457 | 452 | 423 | 309 | 308 | 360 | 408 | 348 |
| 2005 | 220 | 247 | 320 | 328 | 278 | 237 | 271 | 337 | 309 | 389 | 351 | 323 |
| 2006 | 378 | 500 | 482 | 350 | 379 | 349 | 256 | 338 | 401 | 279 | 269 | 271 |
| 2007 | 362 | 498 | 340 | 323 | 378 | 249 | 277 | 419 | 513 | 330 | 309 | 274 |
| 2008 | 366 | 353 | 258 | 267 | 223 | 230 | 319 | 229 | 323 | 320 | 341 | 550 |
| 2009 | 392 | 341 | 366 | 325 | 250 | 286 | 244 | 211 | 263 | 191 | 208 | 358 |
| 2010 | 391 | 270 | 334 | 424 | 401 | 486 | 433 | 847 | 584 | 608 | 936 | 755 |
| 2011 | 493 | 430 | 665 | 683 | 486 | 451 | 316 | 557 | 245 | 240 | 411 | 246 |
| 2012 | 450 | 417 | 346 | 375 | 493 | 304 | 487 | 500 | 526 | 534 | 667 | 626 |
| 2013 | 555 | 373 | 295 | 352 | 435 | 361 | 360 | 312 | 646 | 286 | 464 | 281 |
| 2014 | 337 | 392 | 306 | 422 | 294 | 289 | 326 | 224 | 538 | 655 | 394 | 386 |
| 2015 | 256 | 227 | 344 | 156 | 250 | 283 | 202 | 204 | 220 | 388 | 237 | 222 |
| 2016 | 493 | 342 | 279 | 251 | 315 | 254 | 314 | 292 | 287 | 323 | 266 | 285 |
| 2017 | 198 | 298 | 292 | 305 | 361 | 196 | 343 | 210 | 365 | 311 | 357 | 263 |
| 2018 | 205 | 259 | 319 | 261 | 253 | 234 | 302 | 267 | 274 | 260 | 246 | 270 |
| 2019 | 256 | 292 | 239 | 170 | 214 | 319 | 357 | 378 | 333 | 338 | 363 | 449 |
| 2020 | 285 | 571 | 457 | 492 | 406 | 312 | 413 | 407 | 409 | 286 | 290 | 410 |
| 2021 | 341 | 370 | 321 | 232 | 258 | 245 | 280 | 295 | 244 | 218 | 331 | 241 |
| 2022 | 300 | 296 | 371 | 328 | 443 | 401 | 324 | 222 | 220 | 297 | 351 | 353 |
| 2023 | 250 | 269 | 419 | 315 | 261 | 293 | 252 | 216 | 160 | 153 | 385 | 355 |
| 2024 | 286 | |||||||||||
| - = No Data Reported; -- = Not Applicable; NA = Not Available; W = Withheld to avoid disclosure of individual company data. |
| Release Date: 3/29/2024 |
| Next Release Date: 4/30/2024 |