|
Download Data (XLS File) |
|
||||||||
|
||||||||
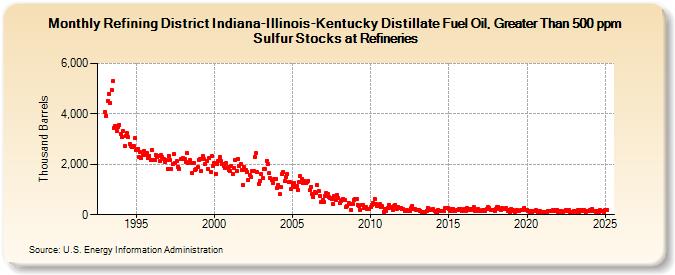
| Refining District Indiana-Illinois-Kentucky Distillate Fuel Oil, Greater Than 500 ppm Sulfur Stocks at Refineries (Thousand Barrels) | ||||||||
| Year | Jan | Feb | Mar | Apr | May | Jun | Jul | Aug | Sep | Oct | Nov | Dec |
|---|---|---|---|---|---|---|---|---|---|---|---|---|
| 1993 | 4,083 | 3,913 | 4,511 | 4,793 | 4,435 | 4,952 | 5,299 | 3,444 | 3,520 | 3,331 | 3,464 | 3,572 |
| 1994 | 3,222 | 3,101 | 3,323 | 2,712 | 3,127 | 3,230 | 3,081 | 2,825 | 2,707 | 2,670 | 2,716 | 3,031 |
| 1995 | 2,574 | 2,596 | 2,278 | 2,485 | 2,267 | 2,354 | 2,547 | 2,363 | 2,451 | 2,239 | 2,340 | 2,157 |
| 1996 | 2,570 | 2,156 | 2,189 | 2,376 | 2,299 | 2,320 | 2,132 | 2,354 | 2,296 | 2,199 | 2,090 | 2,168 |
| 1997 | 1,819 | 2,336 | 2,169 | 1,827 | 2,014 | 2,403 | 2,047 | 2,118 | 1,911 | 1,830 | 2,199 | 2,230 |
| 1998 | 2,257 | 2,226 | 2,093 | 2,458 | 2,034 | 2,187 | 2,048 | 1,659 | 2,053 | 1,780 | 1,816 | 1,887 |
| 1999 | 2,182 | 2,208 | 1,739 | 2,338 | 2,211 | 2,027 | 2,121 | 1,830 | 2,239 | 1,702 | 2,332 | 1,920 |
| 2000 | 2,065 | 1,634 | 1,996 | 2,149 | 2,270 | 2,117 | 2,023 | 1,949 | 1,873 | 2,041 | 1,878 | 1,772 |
| 2001 | 1,753 | 1,938 | 1,621 | 1,863 | 2,158 | 1,733 | 2,210 | 1,942 | 1,993 | 1,783 | 1,197 | 1,891 |
| 2002 | 1,763 | 1,708 | 1,396 | 1,591 | 1,501 | 1,733 | 1,740 | 2,304 | 2,429 | 1,678 | 1,230 | 1,348 |
| 2003 | 1,634 | 1,452 | 1,800 | 1,798 | 2,145 | 2,025 | 1,643 | 1,451 | 1,366 | 1,274 | 1,413 | 1,417 |
| 2004 | 1,042 | 1,197 | 804 | 1,092 | 1,607 | 1,686 | 1,327 | 1,479 | 1,611 | 1,308 | 1,293 | 1,009 |
| 2005 | 1,175 | 1,263 | 1,087 | 1,151 | 978 | 1,298 | 1,521 | 1,433 | 1,245 | 1,335 | 1,276 | 1,311 |
| 2006 | 1,345 | 964 | 1,093 | 819 | 721 | 890 | 876 | 1,166 | 927 | 749 | 486 | 574 |
| 2007 | 502 | 755 | 868 | 820 | 687 | 671 | 614 | 438 | 758 | 577 | 796 | 665 |
| 2008 | 454 | 552 | 586 | 637 | 591 | 290 | 340 | 476 | 410 | 200 | 442 | 601 |
| 2009 | 612 | 605 | 394 | 364 | 185 | 389 | 400 | 266 | 296 | 233 | 245 | 237 |
| 2010 | 290 | 374 | 459 | 615 | 427 | 351 | 333 | 406 | 296 | 330 | 123 | 216 |
| 2011 | 158 | 284 | 399 | 262 | 319 | 195 | 364 | 405 | 234 | 312 | 268 | 272 |
| 2012 | 244 | 217 | 164 | 152 | 176 | 158 | 135 | 256 | 360 | 230 | 245 | 205 |
| 2013 | 190 | 185 | 167 | 87 | 116 | 121 | 119 | 152 | 264 | 231 | 172 | 191 |
| 2014 | 218 | 152 | 115 | 116 | 189 | 132 | 160 | 140 | 152 | 273 | 279 | 249 |
| 2015 | 216 | 144 | 223 | 210 | 162 | 138 | 183 | 198 | 208 | 219 | 137 | 180 |
| 2016 | 235 | 148 | 253 | 182 | 222 | 205 | 232 | 304 | 157 | 149 | 220 | 168 |
| 2017 | 136 | 157 | 177 | 182 | 163 | 208 | 295 | 257 | 204 | 175 | 196 | 131 |
| 2018 | 243 | 311 | 299 | 216 | 199 | 257 | 210 | 246 | 275 | 160 | 183 | 119 |
| 2019 | 240 | 170 | 156 | 125 | 190 | 153 | 146 | 175 | 198 | 178 | 286 | 189 |
| 2020 | 196 | 151 | 120 | 129 | 104 | 138 | 158 | 174 | 104 | 159 | 146 | 118 |
| 2021 | 101 | 81 | 104 | 117 | 148 | 140 | 132 | 133 | 193 | 166 | 183 | 205 |
| 2022 | 125 | 132 | 152 | 95 | 127 | 138 | 174 | 155 | 174 | 113 | 112 | 122 |
| 2023 | 151 | 134 | 122 | 181 | 99 | 201 | 153 | 176 | 183 | 97 | 132 | 155 |
| 2024 | 184 | |||||||||||
| - = No Data Reported; -- = Not Applicable; NA = Not Available; W = Withheld to avoid disclosure of individual company data. |
| Release Date: 3/29/2024 |
| Next Release Date: 4/30/2024 |