|
Download Data (XLS File) |
|
||||||||
|
||||||||
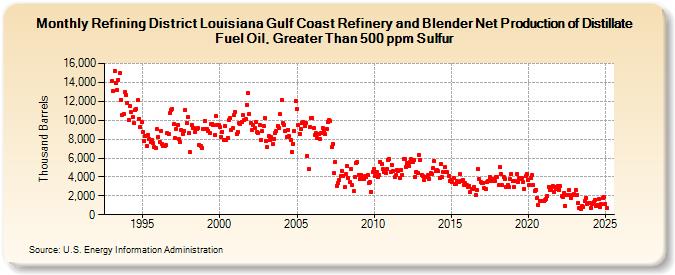
| Refining District Louisiana Gulf Coast Refinery and Blender Net Production of Distillate Fuel Oil, Greater Than 500 ppm Sulfur (Thousand Barrels) | ||||||||
| Year | Jan | Feb | Mar | Apr | May | Jun | Jul | Aug | Sep | Oct | Nov | Dec |
|---|---|---|---|---|---|---|---|---|---|---|---|---|
| 1993 | 14,199 | 13,097 | 15,244 | 13,939 | 13,199 | 14,297 | 14,983 | 12,163 | 10,592 | 10,634 | 12,953 | 12,627 |
| 1994 | 11,855 | 10,059 | 11,460 | 10,891 | 10,386 | 9,672 | 11,036 | 11,221 | 12,091 | 10,116 | 9,253 | 9,799 |
| 1995 | 8,707 | 7,762 | 8,347 | 7,294 | 8,479 | 8,059 | 7,704 | 7,856 | 7,602 | 7,184 | 7,094 | 9,031 |
| 1996 | 8,196 | 7,646 | 8,826 | 7,514 | 7,242 | 7,299 | 7,332 | 8,601 | 8,498 | 10,715 | 11,047 | 11,219 |
| 1997 | 9,586 | 8,099 | 9,079 | 9,511 | 7,964 | 7,668 | 9,002 | 8,568 | 8,885 | 11,125 | 9,702 | 10,328 |
| 1998 | 8,597 | 6,598 | 9,536 | 9,193 | 9,147 | 8,791 | 9,065 | 9,144 | 7,422 | 7,240 | 7,079 | 9,109 |
| 1999 | 9,942 | 9,059 | 9,022 | 8,901 | 8,658 | 9,566 | 9,646 | 9,440 | 8,414 | 10,401 | 9,508 | 9,500 |
| 2000 | 9,298 | 8,219 | 8,797 | 7,913 | 9,394 | 7,892 | 8,125 | 10,048 | 10,193 | 8,910 | 9,134 | 10,524 |
| 2001 | 10,873 | 8,523 | 8,780 | 9,670 | 9,648 | 9,800 | 10,570 | 10,046 | 10,100 | 11,652 | 12,837 | 10,645 |
| 2002 | 9,693 | 8,979 | 9,448 | 9,189 | 9,788 | 8,764 | 8,663 | 9,502 | 7,951 | 8,847 | 9,388 | 10,234 |
| 2003 | 7,800 | 7,121 | 8,293 | 7,904 | 8,171 | 7,453 | 7,974 | 8,656 | 8,903 | 9,388 | 9,209 | 10,621 |
| 2004 | 12,138 | 9,695 | 9,538 | 8,858 | 8,216 | 8,984 | 8,306 | 7,919 | 6,681 | 7,494 | 8,871 | 12,012 |
| 2005 | 11,173 | 9,488 | 8,563 | 9,096 | 9,738 | 9,812 | 9,349 | 9,670 | 6,196 | 4,823 | 9,245 | 10,240 |
| 2006 | 10,230 | 9,138 | 8,460 | 8,608 | 8,076 | 8,504 | 8,008 | 8,681 | 9,164 | 8,874 | 8,490 | 9,055 |
| 2007 | 9,762 | 9,985 | 9,911 | 7,114 | 7,471 | 4,367 | 5,596 | 3,069 | 3,304 | 3,689 | 4,045 | 4,661 |
| 2008 | 4,086 | 2,919 | 4,276 | 5,115 | 3,876 | 3,455 | 4,888 | 3,127 | 2,470 | 3,995 | 5,521 | 5,548 |
| 2009 | 4,228 | 3,795 | 4,186 | 3,801 | 3,737 | 4,145 | 4,010 | 4,188 | 3,356 | 3,450 | 2,418 | 4,500 |
| 2010 | 4,826 | 4,142 | 4,477 | 4,024 | 4,253 | 5,586 | 5,352 | 4,797 | 4,480 | 4,454 | 4,825 | 5,747 |
| 2011 | 5,885 | 4,543 | 5,307 | 4,603 | 3,962 | 4,219 | 4,733 | 4,677 | 3,903 | 4,773 | 4,175 | 5,924 |
| 2012 | 5,895 | 5,032 | 5,487 | 5,188 | 5,602 | 5,860 | 5,569 | 5,828 | 4,038 | 4,520 | 4,416 | 6,333 |
| 2013 | 5,817 | 4,209 | 4,071 | 3,634 | 3,966 | 3,963 | 4,164 | 3,805 | 4,436 | 4,298 | 4,924 | 5,673 |
| 2014 | 4,626 | 4,701 | 4,580 | 3,869 | 5,376 | 3,950 | 4,492 | 4,999 | 4,470 | 4,490 | 4,105 | 3,601 |
| 2015 | 3,669 | 3,468 | 3,908 | 3,239 | 3,222 | 3,553 | 3,424 | 4,272 | 3,608 | 3,711 | 3,111 | 3,349 |
| 2016 | 3,182 | 2,962 | 3,086 | 2,372 | 2,751 | 2,721 | 2,914 | 2,071 | 2,640 | 4,832 | 3,728 | 3,512 |
| 2017 | 3,384 | 3,407 | 2,777 | 2,689 | 3,441 | 3,570 | 3,965 | 3,610 | 3,776 | 3,678 | 3,616 | 4,040 |
| 2018 | 4,013 | 3,096 | 5,041 | 4,311 | 3,094 | 4,016 | 3,726 | 2,954 | 3,119 | 2,937 | 3,753 | 4,323 |
| 2019 | 3,560 | 2,933 | 3,609 | 4,281 | 3,470 | 3,923 | 3,758 | 3,881 | 3,468 | 2,770 | 4,107 | 4,263 |
| 2020 | 3,667 | 3,178 | 3,858 | 4,165 | 3,124 | 2,534 | 2,654 | 1,811 | 1,021 | 1,450 | 1,477 | 1,445 |
| 2021 | 1,449 | 1,520 | 1,704 | 2,000 | 2,961 | 2,640 | 2,617 | 3,061 | 2,411 | 2,983 | 2,749 | 3,083 |
| 2022 | 2,641 | 2,993 | 1,932 | 1,916 | 2,336 | 937 | 2,066 | 2,095 | 2,622 | 1,771 | 2,060 | 2,103 |
| 2023 | 2,169 | 2,640 | 2,093 | 1,242 | 695 | 634 | 918 | 768 | 1,436 | 1,799 | 1,086 | 1,262 |
| 2024 | 1,258 | |||||||||||
| - = No Data Reported; -- = Not Applicable; NA = Not Available; W = Withheld to avoid disclosure of individual company data. |
| Release Date: 3/29/2024 |
| Next Release Date: 4/30/2024 |