|
Download Data (XLS File) |
|
||||||||
|
||||||||
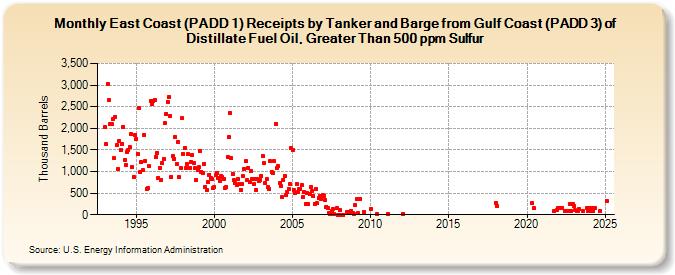
| East Coast (PADD 1) Receipts by Tanker and Barge from Gulf Coast (PADD 3) of Distillate Fuel Oil, Greater Than 500 ppm Sulfur (Thousand Barrels) | ||||||||
| Year | Jan | Feb | Mar | Apr | May | Jun | Jul | Aug | Sep | Oct | Nov | Dec |
|---|---|---|---|---|---|---|---|---|---|---|---|---|
| 1993 | 2,029 | 1,628 | 3,032 | 2,647 | 2,093 | 2,102 | 2,211 | 1,305 | 2,270 | 1,623 | 1,055 | 1,704 |
| 1994 | 1,502 | 1,642 | 2,038 | 1,272 | 1,162 | 1,440 | 1,508 | 1,562 | 1,873 | 1,096 | 881 | 1,846 |
| 1995 | 1,763 | 1,413 | 2,469 | 990 | 1,212 | 1,027 | 1,841 | 1,244 | 592 | 616 | 1,116 | 2,630 |
| 1996 | 2,573 | 2,624 | 2,663 | 1,343 | 1,437 | 852 | 1,089 | 808 | 1,189 | 1,288 | 2,114 | 2,342 |
| 1997 | 2,610 | 2,733 | 2,288 | 878 | 1,358 | 1,296 | 1,794 | 1,175 | 1,692 | 864 | 1,079 | 2,227 |
| 1998 | 1,407 | 1,550 | 1,092 | 1,183 | 1,405 | 1,092 | 1,228 | 1,383 | 1,192 | 1,091 | 811 | 1,031 |
| 1999 | 1,096 | 1,475 | 997 | 968 | 1,175 | 648 | 579 | 765 | 929 | 847 | 819 | 607 |
| 2000 | 637 | 909 | 967 | 856 | 782 | 895 | 873 | 838 | 626 | 642 | 1,344 | 1,792 |
| 2001 | 2,356 | 1,309 | 952 | 797 | 725 | 688 | 821 | 703 | 575 | 718 | 890 | 1,063 |
| 2002 | 1,233 | 792 | 1,082 | 764 | 1,017 | 825 | 704 | 824 | 583 | 824 | 786 | 800 |
| 2003 | 903 | 1,349 | 1,187 | 740 | 817 | 631 | 590 | 1,235 | 978 | 969 | 1,233 | 2,109 |
| 2004 | 1,092 | 1,121 | 724 | 669 | 413 | 807 | 903 | 446 | 522 | 603 | 711 | 1,548 |
| 2005 | 1,495 | 561 | 497 | 710 | 533 | 593 | 604 | 682 | 417 | 532 | 242 | 505 |
| 2006 | 245 | 476 | 640 | 549 | 427 | 255 | 599 | 264 | 377 | 426 | 374 | 447 |
| 2007 | 440 | 335 | 188 | 153 | 46 | 20 | 97 | 133 | 14 | 144 | 0 | |
| 2008 | 100 | 0 | 0 | 0 | 56 | 65 | 73 | 95 | 40 | 15 | ||
| 2009 | 214 | 361 | 31 | 366 | 70 | |||||||
| 2010 | 139 | 7 | ||||||||||
| 2011 | 21 | |||||||||||
| 2012 | 28 | |||||||||||
| 2018 | 269 | 200 | ||||||||||
| 2020 | 263 | 150 | ||||||||||
| 2021 | 80 | 102 | ||||||||||
| 2022 | 145 | 162 | 163 | 164 | 81 | 81 | 81 | 248 | 76 | 249 | ||
| 2023 | 210 | 100 | 82 | 82 | 121 | 82 | 160 | 80 | ||||
| 2024 | 161 | |||||||||||
| - = No Data Reported; -- = Not Applicable; NA = Not Available; W = Withheld to avoid disclosure of individual company data. |
| Release Date: 3/29/2024 |
| Next Release Date: 4/30/2024 |