|
Download Data (XLS File) |
|
||||||||
|
||||||||
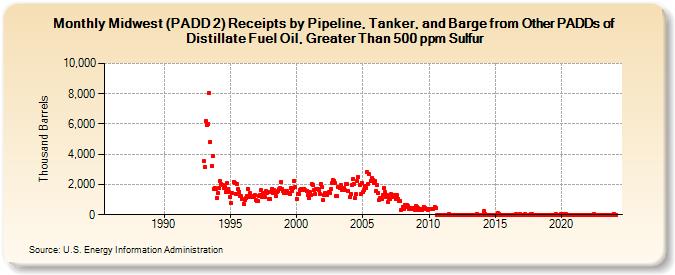
| Midwest (PADD 2) Receipts by Pipeline, Tanker, and Barge from Other PADDs of Distillate Fuel Oil, Greater Than 500 ppm Sulfur (Thousand Barrels) | ||||||||
| Year | Jan | Feb | Mar | Apr | May | Jun | Jul | Aug | Sep | Oct | Nov | Dec |
|---|---|---|---|---|---|---|---|---|---|---|---|---|
| 1986 | -- | -- | -- | -- | -- | -- | -- | -- | -- | -- | -- | -- |
| 1987 | -- | -- | -- | -- | -- | -- | -- | -- | -- | -- | -- | -- |
| 1988 | -- | -- | -- | -- | -- | -- | -- | -- | -- | -- | -- | -- |
| 1989 | -- | -- | -- | -- | -- | -- | -- | -- | -- | -- | -- | -- |
| 1990 | -- | -- | -- | -- | -- | -- | -- | -- | -- | -- | -- | -- |
| 1991 | -- | -- | -- | -- | -- | -- | -- | -- | -- | -- | -- | -- |
| 1992 | -- | -- | -- | -- | -- | -- | -- | -- | -- | -- | -- | -- |
| 1993 | 3,525 | 3,152 | 6,208 | 5,929 | 5,999 | 8,021 | 4,808 | 3,219 | 3,857 | 1,732 | 1,796 | 1,706 |
| 1994 | 1,126 | 1,420 | 1,750 | 2,202 | 2,001 | 1,939 | 1,747 | 1,852 | 1,520 | 2,107 | 1,725 | 1,522 |
| 1995 | 1,199 | 752 | 1,440 | 2,195 | 2,081 | 1,395 | 2,014 | 1,681 | 1,522 | 1,229 | 1,209 | 1,047 |
| 1996 | 726 | 962 | 1,103 | 1,258 | 1,729 | 1,201 | 1,432 | 1,158 | 1,262 | 1,160 | 1,271 | 978 |
| 1997 | 883 | 905 | 1,222 | 1,318 | 1,605 | 1,158 | 1,437 | 1,173 | 1,546 | 1,413 | 1,524 | 1,014 |
| 1998 | 1,027 | 1,499 | 1,711 | 1,456 | 1,603 | 1,236 | 1,514 | 1,561 | 1,677 | 1,743 | 2,170 | 1,713 |
| 1999 | 1,568 | 1,419 | 1,562 | 1,592 | 1,418 | 1,432 | 1,394 | 1,770 | 1,593 | 1,775 | 2,232 | 1,803 |
| 2000 | 1,054 | 1,358 | 1,370 | 1,627 | 1,704 | 1,632 | 1,626 | 1,725 | 1,614 | 1,578 | 1,314 | 1,120 |
| 2001 | 1,520 | 1,322 | 2,018 | 1,995 | 1,632 | 1,379 | 1,702 | 1,716 | 1,633 | 1,388 | 2,001 | 1,830 |
| 2002 | 950 | 1,288 | 1,420 | 1,343 | 1,334 | 1,474 | 1,451 | 1,673 | 2,127 | 2,295 | 2,226 | 2,079 |
| 2003 | 1,245 | 1,215 | 1,829 | 1,792 | 1,963 | 1,662 | 1,609 | 1,794 | 1,608 | 2,042 | 2,012 | 1,557 |
| 2004 | 1,151 | 1,396 | 1,961 | 2,378 | 2,050 | 1,107 | 1,347 | 2,234 | 2,484 | 1,982 | 1,361 | 2,073 |
| 2005 | 1,515 | 1,630 | 1,919 | 1,787 | 2,812 | 2,040 | 2,666 | 2,254 | 2,428 | 2,325 | 2,091 | 2,204 |
| 2006 | 1,572 | 1,940 | 1,468 | 997 | 1,106 | 1,020 | 1,300 | 1,777 | 1,509 | 1,161 | 1,272 | 869 |
| 2007 | 1,119 | 1,023 | 1,360 | 1,161 | 1,189 | 1,333 | 1,011 | 1,279 | 1,072 | 912 | 920 | 330 |
| 2008 | 518 | 403 | 643 | 530 | 635 | 604 | 410 | 442 | 388 | 461 | 435 | 327 |
| 2009 | 572 | 498 | 414 | 312 | 301 | 364 | 344 | 540 | 432 | 392 | 390 | 325 |
| 2010 | 357 | 354 | 386 | 381 | 347 | 529 | 459 | 0 | 0 | 0 | 0 | 0 |
| 2011 | 0 | 0 | 0 | 0 | 0 | 0 | 80 | 0 | 0 | 0 | 0 | 0 |
| 2012 | 0 | 0 | 0 | 0 | 0 | 0 | 0 | 0 | 0 | 0 | 0 | 0 |
| 2013 | 0 | 0 | 0 | 0 | 0 | 0 | 0 | 77 | 0 | 0 | 0 | 0 |
| 2014 | 0 | 0 | 226 | 73 | 0 | 0 | 0 | 0 | 0 | 0 | 0 | 0 |
| 2015 | 0 | 0 | 123 | 71 | 0 | 0 | 0 | 0 | 0 | 0 | 0 | 0 |
| 2016 | 0 | 0 | 0 | 0 | 0 | 0 | 0 | 47 | 0 | 0 | 45 | 0 |
| 2017 | 7 | 0 | 0 | 45 | 0 | 0 | 0 | 0 | 75 | 44 | 0 | 0 |
| 2018 | 0 | 0 | 0 | 0 | 0 | 0 | 0 | 0 | 0 | 0 | 0 | 0 |
| 2019 | 0 | 0 | 0 | 0 | 0 | 0 | 0 | 51 | 0 | 0 | 0 | 43 |
| 2020 | 22 | 0 | 0 | 46 | 44 | 0 | 0 | 0 | 0 | 0 | 0 | 0 |
| 2021 | 0 | 0 | 0 | 0 | 0 | 0 | 0 | 0 | 0 | 0 | 0 | 0 |
| 2022 | 0 | 0 | 0 | 0 | 0 | 49 | 0 | 0 | 0 | 0 | 0 | 0 |
| 2023 | 0 | 0 | 0 | 0 | 0 | 0 | 0 | 0 | 0 | 0 | 0 | 71 |
| 2024 | 0 | |||||||||||
| - = No Data Reported; -- = Not Applicable; NA = Not Available; W = Withheld to avoid disclosure of individual company data. |
| Release Date: 3/29/2024 |
| Next Release Date: 4/30/2024 |
Referring Pages: