|
Download Data (XLS File) |
|
||||||||
|
||||||||
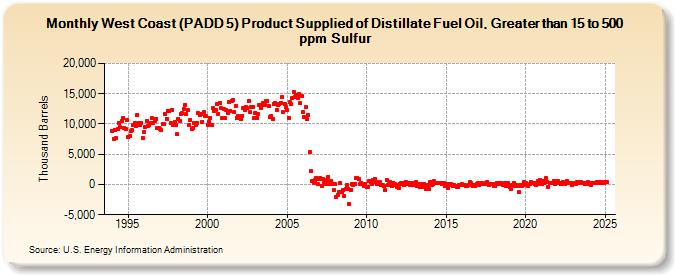
| West Coast (PADD 5) Product Supplied of Distillate Fuel Oil, Greater than 15 to 500 ppm Sulfur (Thousand Barrels) | ||||||||
| Year | Jan | Feb | Mar | Apr | May | Jun | Jul | Aug | Sep | Oct | Nov | Dec |
|---|---|---|---|---|---|---|---|---|---|---|---|---|
| 1994 | 8,805 | 7,591 | 9,071 | 7,614 | 9,087 | 10,209 | 9,490 | 10,506 | 10,930 | 9,255 | 9,173 | 10,596 |
| 1995 | 7,895 | 7,957 | 8,827 | 8,923 | 9,879 | 10,154 | 9,727 | 11,543 | 10,120 | 9,838 | 10,183 | 7,738 |
| 1996 | 8,605 | 9,452 | 10,548 | 9,744 | 9,772 | 10,083 | 10,909 | 10,206 | 10,479 | 10,841 | 9,355 | 9,399 |
| 1997 | 9,228 | 8,924 | 9,989 | 10,052 | 11,626 | 10,893 | 12,201 | 12,073 | 10,205 | 12,321 | 9,780 | 10,372 |
| 1998 | 9,852 | 8,283 | 10,857 | 10,520 | 11,581 | 11,800 | 12,465 | 13,215 | 11,604 | 12,291 | 9,904 | 10,673 |
| 1999 | 9,147 | 9,279 | 10,229 | 9,790 | 10,222 | 11,768 | 11,486 | 11,649 | 10,400 | 12,014 | 11,389 | 11,273 |
| 2000 | 9,874 | 10,379 | 11,004 | 9,889 | 12,667 | 12,077 | 12,321 | 13,224 | 11,730 | 13,528 | 12,640 | 10,964 |
| 2001 | 12,493 | 10,926 | 12,255 | 11,877 | 13,575 | 12,219 | 13,728 | 13,956 | 11,998 | 12,912 | 11,065 | 11,271 |
| 2002 | 11,222 | 10,843 | 11,371 | 12,662 | 12,316 | 12,885 | 12,579 | 13,761 | 11,929 | 12,883 | 12,751 | 11,042 |
| 2003 | 11,895 | 11,033 | 11,609 | 13,108 | 12,721 | 13,215 | 13,547 | 13,102 | 13,720 | 13,832 | 12,995 | 11,208 |
| 2004 | 11,389 | 10,874 | 13,243 | 13,473 | 12,302 | 13,184 | 13,341 | 13,467 | 14,391 | 11,990 | 13,357 | 12,867 |
| 2005 | 12,303 | 10,989 | 13,555 | 13,232 | 14,246 | 15,296 | 14,439 | 14,746 | 14,278 | 14,910 | 13,424 | 14,562 |
| 2006 | 11,992 | 11,073 | 12,731 | 10,742 | 11,475 | 5,360 | 2,226 | 546 | 297 | 725 | 1,122 | 44 |
| 2007 | 892 | 1,079 | -193 | 869 | 220 | 156 | 664 | 1,308 | 71 | 652 | 151 | -928 |
| 2008 | 75 | -2,079 | -1,661 | -1,222 | 198 | -1,323 | -912 | -1,977 | -815 | -163 | -743 | -3,206 |
| 2009 | -838 | 30 | -102 | 131 | 1,104 | 1,035 | 980 | 114 | 205 | 154 | -171 | 116 |
| 2010 | -472 | -352 | 618 | 341 | 29 | 670 | 966 | 445 | 56 | 148 | 420 | -104 |
| 2011 | -162 | -292 | -966 | 775 | -156 | 158 | 379 | -267 | 181 | 122 | -11 | -342 |
| 2012 | -566 | 26 | 225 | 266 | -108 | 188 | 389 | 127 | 197 | -147 | 266 | -17 |
| 2013 | -116 | 375 | -319 | 154 | -369 | -463 | 119 | 77 | -405 | -773 | -98 | -802 |
| 2014 | 401 | -131 | 38 | 531 | 266 | 170 | 310 | 306 | 205 | 80 | 162 | -192 |
| 2015 | 38 | -665 | 68 | -99 | 40 | -243 | -11 | -246 | -442 | -362 | -87 | -149 |
| 2016 | 74 | -107 | -115 | -296 | -256 | -25 | 352 | 165 | -180 | -27 | -197 | 118 |
| 2017 | 218 | -161 | 55 | 273 | 123 | 71 | 162 | 336 | -163 | 134 | 89 | 52 |
| 2018 | -188 | -243 | 277 | 118 | 216 | 207 | 103 | -107 | 277 | -290 | 154 | 234 |
| 2019 | -470 | -777 | -149 | 215 | -189 | -35 | -258 | -1,201 | -55 | -196 | -25 | 334 |
| 2020 | 295 | -9 | -199 | 44 | 339 | 225 | 219 | 67 | -95 | 525 | -1 | 669 |
| 2021 | 84 | 527 | 215 | 1,004 | 353 | -369 | 174 | 286 | 164 | 517 | 6 | 339 |
| 2022 | 617 | 268 | 164 | 4 | 347 | 217 | 149 | 640 | 219 | 302 | 272 | -51 |
| 2023 | 150 | 107 | 71 | 328 | 236 | 382 | 352 | 226 | 273 | -3 | 0 | 363 |
| 2024 | 325 | |||||||||||
| - = No Data Reported; -- = Not Applicable; NA = Not Available; W = Withheld to avoid disclosure of individual company data. |
| Release Date: 3/29/2024 |
| Next Release Date: 4/30/2024 |