|
Download Data (XLS File) |
|
||||||||
|
||||||||
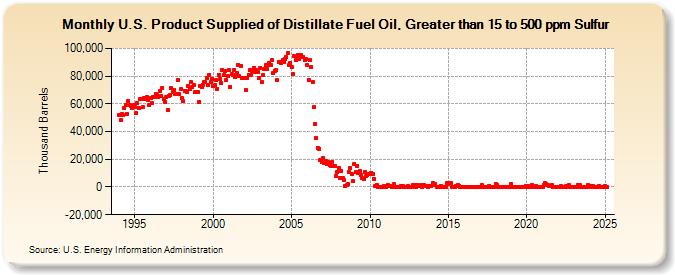
| U.S. Product Supplied of Distillate Fuel Oil, Greater than 15 to 500 ppm Sulfur (Thousand Barrels) | ||||||||
| Year | Jan | Feb | Mar | Apr | May | Jun | Jul | Aug | Sep | Oct | Nov | Dec |
|---|---|---|---|---|---|---|---|---|---|---|---|---|
| 1994 | 51,661 | 48,468 | 52,329 | 51,967 | 56,718 | 58,899 | 52,715 | 61,693 | 58,800 | 58,214 | 56,943 | 58,804 |
| 1995 | 57,945 | 53,063 | 60,387 | 56,854 | 63,149 | 63,192 | 57,518 | 64,190 | 63,837 | 64,708 | 62,462 | 58,921 |
| 1996 | 64,110 | 60,393 | 65,071 | 64,679 | 67,141 | 66,149 | 64,750 | 68,968 | 65,849 | 71,631 | 63,304 | 61,298 |
| 1997 | 64,666 | 55,416 | 65,802 | 66,148 | 71,222 | 68,679 | 70,058 | 67,353 | 67,418 | 77,206 | 66,855 | 70,481 |
| 1998 | 63,906 | 61,934 | 69,367 | 69,395 | 68,569 | 72,780 | 70,726 | 75,690 | 71,843 | 73,846 | 68,207 | 68,734 |
| 1999 | 68,827 | 61,660 | 73,094 | 72,055 | 73,792 | 75,475 | 75,673 | 78,581 | 73,269 | 81,043 | 75,860 | 78,025 |
| 2000 | 72,793 | 73,517 | 76,837 | 71,003 | 81,156 | 77,786 | 75,120 | 84,689 | 80,870 | 83,874 | 76,966 | 79,869 |
| 2001 | 84,207 | 72,458 | 81,440 | 80,453 | 84,600 | 79,653 | 82,185 | 88,325 | 79,761 | 87,461 | 78,707 | 78,290 |
| 2002 | 78,776 | 69,724 | 78,385 | 81,039 | 84,175 | 81,091 | 84,028 | 85,999 | 83,080 | 84,369 | 82,650 | 78,780 |
| 2003 | 86,209 | 75,577 | 80,913 | 84,796 | 87,721 | 85,014 | 88,203 | 89,140 | 87,702 | 91,329 | 82,249 | 84,014 |
| 2004 | 84,136 | 76,990 | 90,064 | 90,362 | 89,704 | 91,452 | 90,255 | 92,144 | 93,766 | 96,781 | 87,681 | 89,193 |
| 2005 | 86,373 | 81,203 | 94,518 | 91,361 | 93,588 | 95,361 | 92,684 | 95,115 | 93,565 | 93,857 | 91,443 | 92,165 |
| 2006 | 87,899 | 77,384 | 91,458 | 86,499 | 75,706 | 57,468 | 45,468 | 35,466 | 28,476 | 27,681 | 19,214 | 18,260 |
| 2007 | 20,689 | 16,978 | 18,428 | 16,728 | 17,957 | 15,648 | 14,828 | 18,161 | 15,293 | 15,108 | 8,243 | 10,867 |
| 2008 | 13,437 | 6,719 | 11,703 | 6,437 | 5,359 | 986 | 1,243 | 1,813 | 10,495 | 13,600 | 9,086 | 4,136 |
| 2009 | 16,799 | 10,933 | 15,477 | 9,985 | 11,215 | 8,545 | 6,329 | 6,029 | 10,562 | 7,985 | 8,597 | 9,524 |
| 2010 | 9,252 | 10,430 | 9,252 | 5,973 | 778 | 1,518 | 301 | 214 | 155 | 103 | 62 | 404 |
| 2011 | 162 | 608 | 1,298 | 809 | 401 | 317 | 1,843 | 223 | 210 | 144 | 279 | 258 |
| 2012 | 745 | 537 | 129 | 184 | 146 | 529 | 168 | 101 | 10 | 1,709 | 1,360 | 220 |
| 2013 | 1,604 | 717 | 605 | 1,761 | 77 | 1,572 | 576 | 418 | 81 | 771 | 435 | 812 |
| 2014 | 2,753 | 1,528 | 1,858 | 59 | 19 | 60 | 1,013 | 67 | 67 | 59 | 71 | 2,730 |
| 2015 | 2,259 | 2,554 | 2,790 | 4 | 54 | 33 | 833 | 1,286 | 735 | 34 | -180 | 91 |
| 2016 | 88 | 66 | 123 | 168 | 52 | 124 | 107 | 208 | 178 | 98 | 174 | 98 |
| 2017 | 53 | 85 | 1,205 | 41 | 59 | 53 | 83 | 478 | 28 | 63 | 35 | 27 |
| 2018 | 2,328 | 1,259 | 161 | 220 | 205 | 234 | 306 | 134 | 205 | 123 | 264 | 219 |
| 2019 | 2,106 | 198 | 4 | 40 | 51 | 33 | 63 | 13 | 61 | 259 | 16 | 787 |
| 2020 | 294 | 680 | 32 | 1 | 1,590 | 30 | 74 | 729 | 0 | 213 | 24 | 42 |
| 2021 | 344 | 1,328 | 2,787 | 1,883 | 1,332 | 976 | 475 | 1,115 | 66 | 173 | 266 | 153 |
| 2022 | 51 | 100 | 373 | 24 | 14 | 262 | 530 | 7 | 1,211 | 137 | 72 | 265 |
| 2023 | 49 | 191 | 71 | 1,856 | 56 | 910 | 91 | 198 | 602 | 230 | 240 | 1,154 |
| 2024 | 897 | |||||||||||
| - = No Data Reported; -- = Not Applicable; NA = Not Available; W = Withheld to avoid disclosure of individual company data. |
| Release Date: 3/29/2024 |
| Next Release Date: 4/30/2024 |