|
Download Data (XLS File) |
|
||||||||
|
||||||||
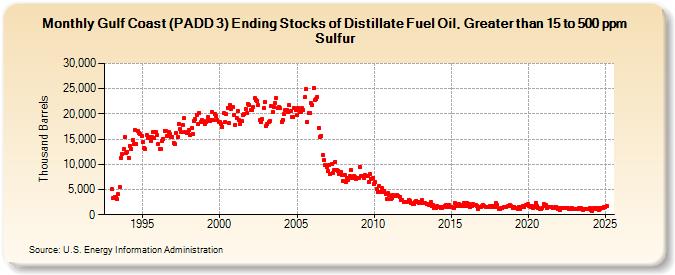
| Gulf Coast (PADD 3) Ending Stocks of Distillate Fuel Oil, Greater than 15 to 500 ppm Sulfur (Thousand Barrels) | ||||||||
| Year | Jan | Feb | Mar | Apr | May | Jun | Jul | Aug | Sep | Oct | Nov | Dec |
|---|---|---|---|---|---|---|---|---|---|---|---|---|
| 1993 | 5,046 | 3,308 | 3,423 | 3,425 | 3,052 | 4,047 | 5,466 | 11,327 | 11,958 | 12,952 | 15,402 | 12,181 |
| 1994 | 12,447 | 11,281 | 13,681 | 13,057 | 14,804 | 14,060 | 16,791 | 13,980 | 16,616 | 16,271 | 15,944 | 15,562 |
| 1995 | 14,413 | 13,306 | 12,946 | 15,871 | 15,247 | 15,463 | 14,583 | 15,443 | 16,399 | 15,120 | 16,378 | 15,739 |
| 1996 | 14,009 | 13,118 | 12,984 | 14,698 | 15,104 | 16,682 | 16,516 | 15,658 | 16,352 | 16,021 | 15,449 | 15,502 |
| 1997 | 14,266 | 13,949 | 16,265 | 15,377 | 18,009 | 16,989 | 16,314 | 17,790 | 19,101 | 16,339 | 16,160 | 16,235 |
| 1998 | 16,791 | 15,731 | 17,220 | 16,087 | 18,672 | 19,012 | 19,855 | 17,954 | 20,229 | 18,328 | 18,723 | 18,614 |
| 1999 | 17,919 | 18,387 | 18,512 | 19,347 | 18,645 | 18,749 | 20,386 | 18,728 | 19,991 | 19,619 | 18,851 | 18,396 |
| 2000 | 18,390 | 18,003 | 17,474 | 20,202 | 18,324 | 19,896 | 21,234 | 18,149 | 21,747 | 21,032 | 21,303 | 19,860 |
| 2001 | 17,802 | 19,087 | 20,551 | 18,715 | 17,964 | 18,609 | 19,796 | 20,063 | 21,054 | 20,126 | 21,903 | 21,739 |
| 2002 | 20,853 | 20,740 | 21,327 | 23,106 | 22,818 | 22,583 | 21,689 | 18,715 | 18,414 | 19,019 | 21,162 | 22,393 |
| 2003 | 17,589 | 17,954 | 18,340 | 18,601 | 21,535 | 20,420 | 21,341 | 22,212 | 23,089 | 21,156 | 21,446 | 21,103 |
| 2004 | 18,442 | 18,850 | 19,911 | 20,676 | 20,851 | 20,414 | 21,752 | 20,512 | 19,340 | 19,423 | 21,119 | 20,748 |
| 2005 | 19,804 | 21,165 | 20,409 | 20,443 | 21,096 | 20,800 | 23,299 | 24,873 | 18,470 | 20,079 | 20,272 | 22,065 |
| 2006 | 21,688 | 25,143 | 22,684 | 23,011 | 23,410 | 17,257 | 15,513 | 15,666 | 11,815 | 10,758 | 9,845 | 9,375 |
| 2007 | 8,758 | 9,923 | 8,067 | 9,987 | 8,297 | 8,841 | 10,549 | 8,782 | 8,729 | 8,009 | 8,535 | 7,813 |
| 2008 | 6,770 | 7,789 | 6,516 | 7,238 | 6,947 | 7,599 | 8,865 | 7,304 | 7,636 | 7,440 | 7,068 | 7,328 |
| 2009 | 7,329 | 9,491 | 7,654 | 7,631 | 7,289 | 7,875 | 7,760 | 7,677 | 6,538 | 8,090 | 7,095 | 7,289 |
| 2010 | 6,192 | 6,489 | 5,066 | 4,604 | 5,665 | 4,588 | 5,398 | 4,474 | 4,729 | 4,150 | 3,158 | 4,279 |
| 2011 | 3,852 | 3,110 | 3,292 | 3,831 | 3,789 | 3,790 | 3,844 | 3,741 | 3,533 | 2,858 | 2,900 | 2,602 |
| 2012 | 2,512 | 2,520 | 2,539 | 3,015 | 2,805 | 2,285 | 2,161 | 2,202 | 2,537 | 2,778 | 2,574 | 2,291 |
| 2013 | 2,569 | 2,832 | 2,237 | 2,351 | 2,269 | 2,073 | 2,103 | 1,891 | 2,449 | 1,660 | 1,926 | 1,430 |
| 2014 | 1,410 | 1,665 | 1,482 | 1,488 | 1,241 | 1,233 | 1,584 | 1,681 | 1,986 | 1,452 | 1,869 | 1,459 |
| 2015 | 1,508 | 1,433 | 1,386 | 2,293 | 2,056 | 1,705 | 2,056 | 1,943 | 1,654 | 1,767 | 2,298 | 1,790 |
| 2016 | 2,279 | 1,656 | 2,085 | 1,471 | 1,757 | 2,131 | 1,885 | 2,025 | 1,782 | 1,124 | 1,569 | 1,465 |
| 2017 | 1,744 | 1,896 | 1,659 | 1,596 | 1,585 | 1,617 | 1,646 | 1,768 | 1,485 | 1,654 | 1,469 | 2,241 |
| 2018 | 1,934 | 1,147 | 1,167 | 1,402 | 1,309 | 1,587 | 1,560 | 1,462 | 1,655 | 1,805 | 1,908 | 1,682 |
| 2019 | 1,267 | 1,579 | 1,314 | 1,275 | 1,092 | 1,580 | 1,170 | 1,552 | 1,809 | 1,549 | 1,838 | 1,955 |
| 2020 | 2,055 | 1,758 | 1,435 | 1,690 | 1,426 | 1,461 | 2,386 | 1,715 | 1,318 | 1,095 | 1,154 | 1,332 |
| 2021 | 2,079 | 1,690 | 1,908 | 1,271 | 1,485 | 1,614 | 1,609 | 1,295 | 1,415 | 1,569 | 1,603 | 1,084 |
| 2022 | 1,335 | 1,002 | 1,387 | 1,319 | 1,363 | 1,408 | 1,386 | 1,234 | 1,228 | 1,161 | 1,360 | 1,131 |
| 2023 | 1,035 | 1,060 | 1,150 | 1,044 | 1,414 | 1,235 | 1,051 | 993 | 1,135 | 1,108 | 1,043 | 1,143 |
| 2024 | 1,378 | |||||||||||
| - = No Data Reported; -- = Not Applicable; NA = Not Available; W = Withheld to avoid disclosure of individual company data. |
| Release Date: 3/29/2024 |
| Next Release Date: 4/30/2024 |