|
Download Data (XLS File) |
|
||||||||
|
||||||||
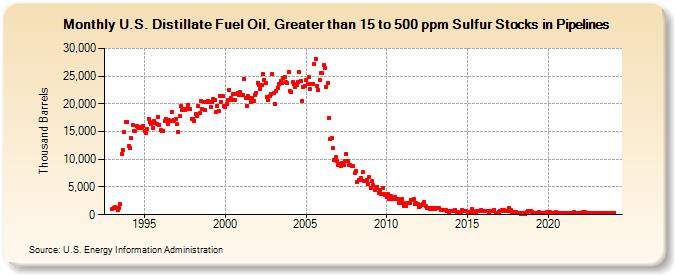
| U.S. Distillate Fuel Oil, Greater than 15 to 500 ppm Sulfur Stocks in Pipelines (Thousand Barrels) | ||||||||
| Year | Jan | Feb | Mar | Apr | May | Jun | Jul | Aug | Sep | Oct | Nov | Dec |
|---|---|---|---|---|---|---|---|---|---|---|---|---|
| 1993 | 1,075 | 1,277 | 1,305 | 1,296 | 877 | 1,267 | 1,847 | 11,035 | 11,619 | 14,897 | 16,811 | 16,796 |
| 1994 | 12,350 | 12,012 | 13,769 | 16,207 | 15,136 | 15,018 | 16,042 | 15,807 | 15,597 | 15,625 | 15,813 | 16,089 |
| 1995 | 15,122 | 14,692 | 15,546 | 17,334 | 16,684 | 16,369 | 15,610 | 16,888 | 16,571 | 16,419 | 17,690 | 16,262 |
| 1996 | 15,198 | 15,028 | 15,131 | 16,955 | 17,217 | 16,386 | 17,089 | 16,887 | 18,552 | 16,894 | 17,051 | 17,208 |
| 1997 | 16,348 | 14,898 | 17,734 | 19,524 | 18,928 | 19,041 | 18,864 | 19,066 | 19,806 | 19,009 | 19,083 | 17,313 |
| 1998 | 17,259 | 16,914 | 18,150 | 17,753 | 19,531 | 18,313 | 20,569 | 19,013 | 20,269 | 18,906 | 20,334 | 20,577 |
| 1999 | 20,399 | 19,473 | 20,410 | 20,931 | 20,640 | 18,493 | 19,688 | 18,707 | 21,422 | 20,359 | 21,377 | 19,607 |
| 2000 | 19,387 | 19,950 | 20,776 | 22,511 | 21,082 | 20,722 | 21,747 | 20,773 | 21,773 | 22,000 | 21,681 | 22,189 |
| 2001 | 21,656 | 21,669 | 24,446 | 21,020 | 19,617 | 21,417 | 21,048 | 20,411 | 21,142 | 20,554 | 21,604 | 21,934 |
| 2002 | 23,797 | 23,429 | 22,764 | 23,358 | 25,375 | 24,360 | 23,842 | 21,265 | 20,609 | 21,489 | 21,833 | 25,391 |
| 2003 | 21,898 | 19,934 | 22,364 | 22,861 | 23,500 | 24,113 | 23,730 | 24,726 | 24,824 | 23,860 | 23,732 | 25,741 |
| 2004 | 22,300 | 22,168 | 23,885 | 23,508 | 22,989 | 23,480 | 23,941 | 25,669 | 24,198 | 20,517 | 23,092 | 23,271 |
| 2005 | 24,243 | 23,500 | 24,798 | 22,612 | 23,500 | 23,554 | 27,198 | 28,156 | 23,254 | 22,561 | 24,240 | 25,509 |
| 2006 | 25,493 | 26,979 | 26,436 | 23,050 | 23,814 | 17,493 | 13,580 | 13,845 | 12,113 | 9,944 | 10,336 | 9,669 |
| 2007 | 8,991 | 9,232 | 8,699 | 9,278 | 9,057 | 9,638 | 11,005 | 9,685 | 9,034 | 8,917 | 8,821 | 8,754 |
| 2008 | 7,549 | 7,870 | 5,923 | 6,250 | 6,289 | 6,548 | 7,662 | 6,144 | 6,028 | 6,212 | 5,597 | 6,723 |
| 2009 | 4,869 | 6,144 | 5,317 | 4,391 | 4,884 | 5,004 | 3,939 | 4,384 | 3,786 | 4,750 | 3,704 | 3,508 |
| 2010 | 3,159 | 3,658 | 2,862 | 3,286 | 2,763 | 2,969 | 3,255 | 2,871 | 2,844 | 2,074 | 2,244 | 2,759 |
| 2011 | 2,132 | 1,565 | 1,645 | 2,048 | 2,092 | 2,037 | 2,587 | 2,600 | 2,772 | 1,993 | 2,067 | 1,895 |
| 2012 | 1,389 | 1,516 | 1,774 | 1,861 | 2,246 | 1,486 | 1,136 | 1,136 | 1,035 | 1,144 | 1,101 | 1,138 |
| 2013 | 1,055 | 1,157 | 1,211 | 1,123 | 916 | 820 | 761 | 765 | 809 | 669 | 518 | 693 |
| 2014 | 609 | 703 | 610 | 867 | 397 | 421 | 321 | 378 | 870 | 741 | 753 | 731 |
| 2015 | 533 | 511 | 532 | 988 | 701 | 565 | 555 | 692 | 602 | 607 | 856 | 619 |
| 2016 | 589 | 711 | 617 | 605 | 571 | 722 | 691 | 676 | 899 | 340 | 347 | 442 |
| 2017 | 740 | 699 | 855 | 796 | 651 | 714 | 652 | 1,274 | 769 | 480 | 551 | 366 |
| 2018 | 487 | 358 | 228 | 260 | 157 | 233 | 315 | 213 | 427 | 686 | 738 | 669 |
| 2019 | 465 | 339 | 380 | 336 | 324 | 423 | 270 | 304 | 320 | 249 | 359 | 411 |
| 2020 | 572 | 406 | 349 | 398 | 338 | 323 | 464 | 384 | 362 | 348 | 240 | 291 |
| 2021 | 287 | 281 | 377 | 236 | 256 | 298 | 364 | 424 | 386 | 373 | 291 | 286 |
| 2022 | 354 | 322 | 425 | 403 | 297 | 279 | 278 | 263 | 303 | 336 | 326 | 377 |
| 2023 | 296 | 300 | 390 | 315 | 378 | 302 | 289 | 256 | 267 | 229 | 299 | 280 |
| 2024 | 346 | |||||||||||
| - = No Data Reported; -- = Not Applicable; NA = Not Available; W = Withheld to avoid disclosure of individual company data. |
| Release Date: 3/29/2024 |
| Next Release Date: 4/30/2024 |